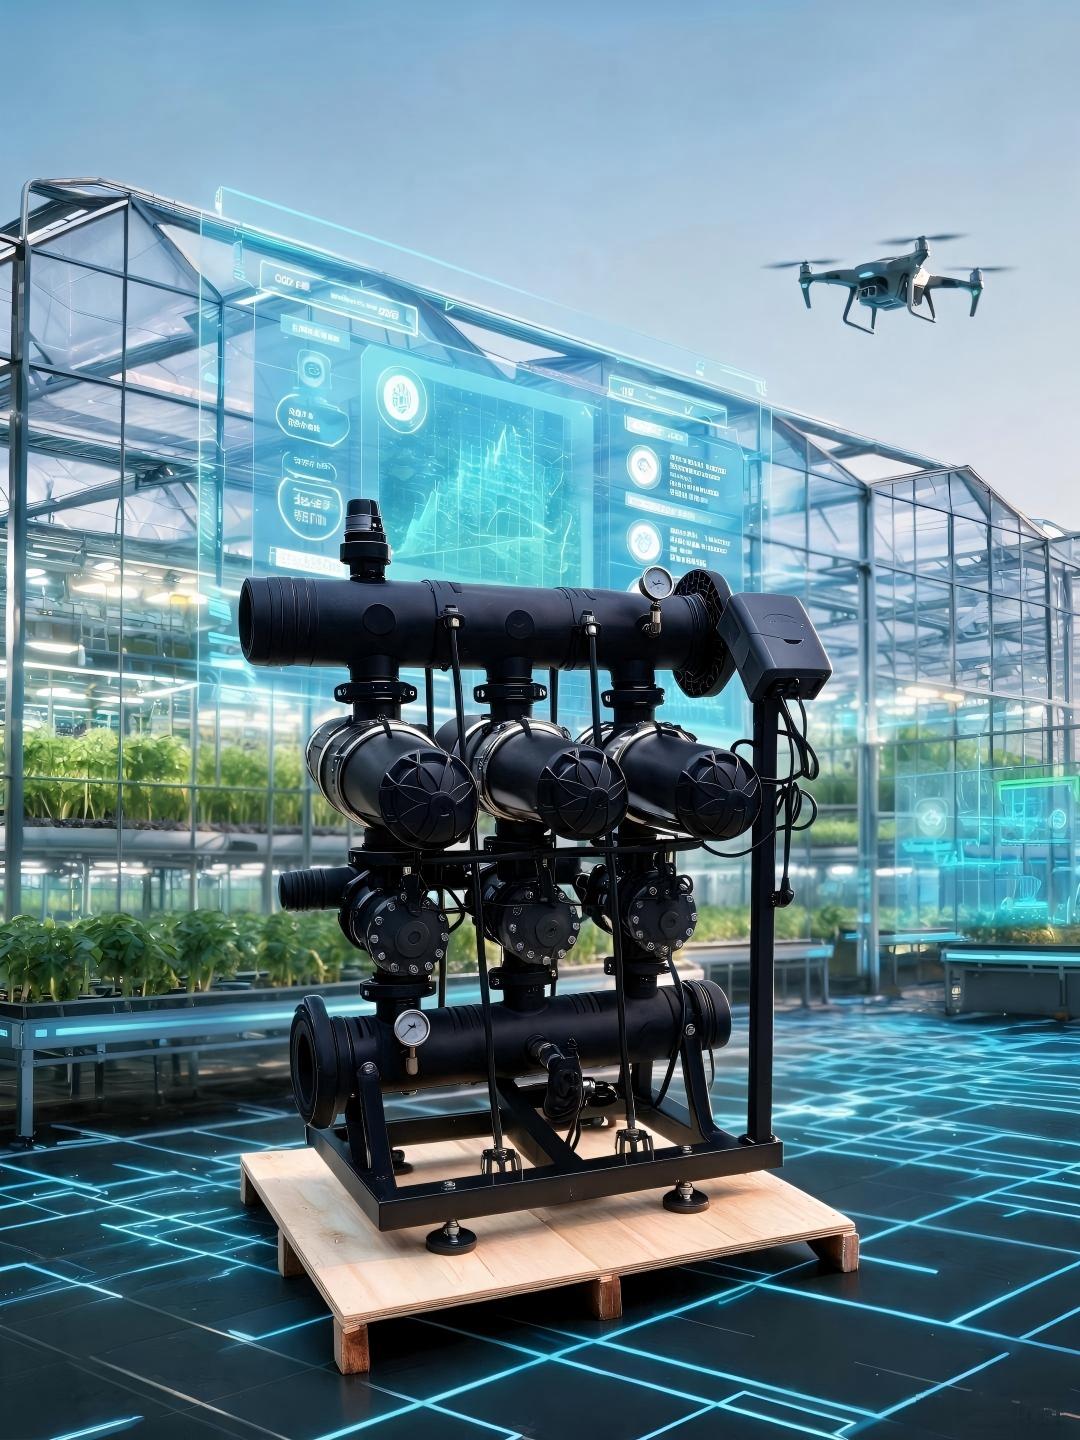
According to 2023 field audit data from the Irrigation Association (IA), 38% of underperforming drip irrigation systems trace their root cause to incorrectly sized pumps—mismatches that increase energy costs by 40-60%, reduce crop water distribution uniformity by 20% or more, and cut system service life by half. Drip irrigation, which delivers water directly to crop root zones to reduce overall water use by 30-60% compared to furrow and 20-40% compared to sprinkler systems (USDA 2024 data), relies on consistent, low pressure and precise flow to achieve its 90%+ application efficiency potential. Unlike sprinkler or furrow systems, which tolerate wider pressure and flow fluctuations, drip emitters (especially pressure-compensating models) require tight pressure control to deliver uniform water across entire fields, making pump sizing the single most impactful design decision for long-term system performance. This guide walks through evidence-based pump sizing calculations, real-world performance data, cost comparisons, and practical examples to help growers, irrigation designers, and equipment installers size pumps for maximum efficiency, yield, and return on investment.
Why Correct Pump Sizing Is Non-Negotiable for Drip Irrigation Performance
Pump sizing does not just refer to horsepower: it refers to matching a pump’s flow output and pressure delivery to the exact hydraulic requirements of the drip system, while operating as close as possible to the pump’s best efficiency point (BEP). The U.S. Department of Energy (DOE) estimates that 60% of agricultural irrigation pumps operate 15% or more outside their BEP, wasting $1.2 billion in energy annually across U.S. farms. For drip systems specifically, sizing errors carry disproportionate costs because of the low operating pressure of drip emitters and high sensitivity to pressure fluctuations.
The High Cost of Oversized Drip Pumps
Many growers default to oversizing pumps “for extra power” or to accommodate unplanned future expansion, but this practice creates cascading issues:
- Reduced energy efficiency: Pumps sized 20% above required flow and total dynamic head (TDH) operate 20-25% outside their BEP, increasing energy use by 30% on average, per DOE testing. For a 75 HP pump irrigating 160 acres of row crops, that translates to $5,400 in unnecessary annual energy costs at $0.12/kWh.
- Premature component failure: Oversized pumps generate excess pressure that causes water hammer, a pressure surge that travels through drip lines at up to 4,000 ft per second. Texas A&M AgriLife Extension data shows water hammer increases emitter blowout rates by 40%, cuts filter service life by 30%, and causes 2x more frequent pipe joint failures.
- High maintenance costs: Pumps operated far from BEP experience increased radial load on impellers and shafts, leading to 2x higher seal and bearing failure rates, per Hydraulic Institute (HI) 2023 research, increasing annual maintenance costs by an average of $1,200 for mid-sized orchard systems.
The High Cost of Undersized Drip Pumps
Undersized pumps, often selected to reduce upfront equipment costs, fail to deliver enough flow and pressure to meet crop water demand during peak evapotranspiration (ET) periods:
- Poor distribution uniformity (DU): Drip systems require a minimum DU of 85% to ensure all crops receive equal water. When pumps are undersized, pressure drops below the minimum required for emitter operation, reducing DU to 60-70%. University of Nebraska-Lincoln (UNL) 2022 trials found that a 70% DU leads to 15-25% yield loss in high-value crops including almonds, processing tomatoes, and highbush blueberries.
- Cavitation damage: Insufficient flow on the suction side of undersized pumps causes low-pressure zones that form water vapor bubbles, which collapse as they move through the impeller. Goulds Water Technology field data shows cavitation can erode brass and stainless steel impellers by 30% in as little as 6 weeks of continuous operation, requiring full pump replacement.
- Crop water stress: During peak ET periods (e.g., mid-summer heatwaves), undersized pumps cannot deliver enough water to meet crop demand, even with 24/7 runtime. A 2024 University of California Agriculture and Natural Resources (UC ANR) study of 200 Central Valley drip orchards found that undersized pumps were responsible for 29% of crop water stress events during the 2022 record heat, leading to 18% average almond yield reduction.
Long-Term Impacts on Crop Yield and System Longevity
A 2023 cost-benefit analysis from the Natural Resources Conservation Service (NRCS) found that correctly sized drip pumps deliver a 3.2 year payback on investment through reduced energy costs, higher yields, and lower maintenance. Over a 15-year system lifespan, correctly sized pumps generate $22,000 to $78,000 in net savings for 40-acre to 160-acre operations, compared to incorrectly sized alternatives. The analysis also found that correctly sized pumps increase drip system tubing and emitter lifespan by 35%, because consistent pressure reduces wear on plastic components.
Core Drip Irrigation Hydraulics to Master Before Sizing a Pump
Sizing a pump without a foundational understanding of drip hydraulics is a recipe for error. Unlike sprinkler systems, which operate at 40-80 psi and tolerate pressure swings of 10 psi or more, drip systems operate at low pressure (10-30 psi for most surface and subsurface drip) and see 50% changes in emitter flow for every 10 psi change in inlet pressure for non-pressure-compensating emitters, per UC ANR testing. Before running calculations, understand these four core metrics:
- Flow Rate (Q): Measured in gallons per minute (gpm), the total volume of water the pump must deliver to meet crop water demand when the largest irrigation zone is active. Unlike sprinkler systems that often run all heads at once, most drip systems are zoned to reduce required pump flow.
- Total Dynamic Head (TDH): Measured in feet of head (1 psi = 2.31 ft of head), the total pressure the pump must generate to move water from the source to the farthest emitter while maintaining rated emitter operating pressure. TDH accounts for elevation changes, friction loss in pipes and components, and required operating pressure.
- Best Efficiency Point (BEP): The flow and head combination where the pump converts electrical or diesel energy to hydraulic energy with maximum efficiency, typically 70-85% for agricultural centrifugal pumps. HI guidelines recommend operating pumps within 80-110% of BEP to maximize efficiency and service life.
- Net Positive Suction Head Required (NPSHr): The minimum pressure required at the pump suction inlet to prevent cavitation, published on all manufacturer pump curves. Designers must ensure available suction head (NPSHa) is at least 2 ft above NPSHr to avoid damage.
Step-by-Step Pump Sizing Calculation for Drip Irrigation
The sizing process follows a standardized, NRCS-endorsed workflow to eliminate guesswork. Even for small-scale farms, skipping steps can lead to 20%+ sizing errors.
Step 1: Calculate Peak Design Flow Rate
Flow rate is based on the maximum water demand of the largest irrigation zone during peak crop ET, not the total acreage of the farm. Use this process:
- Identify peak crop ET (ETc) for your region and crop, using local weather station data (e.g., CIMIS in California, AgriMet in the Pacific Northwest, High Plains Regional Climate Center data for the Great Plains). For example, mature almonds in the Central Valley have a peak ETc of 0.28 inches per day in July; processing tomatoes in the Midwest have a peak ETc of 0.24 inches per day in August.
- Map irrigation zones: Divide fields into zones based on soil type, crop type, and slope, ensuring no zone requires more flow than available from water supply (e.g., well yield, canal delivery capacity).
- Calculate required zone flow using emitter specs: For each zone, count the total number of emitters, multiply by individual emitter flow rate (in gph), then divide by 60 to get gpm. For example, a 2.5 acre blueberry zone with 5,445 0.5 gph emitters has a total flow of 2,722 gph = 45 gpm.
- Cross-verify with ET demand: Use the formula Q (gpm) = (Zone area in sq ft * Peak ETc in inches/day * 0.623 gal/sq ft/in) / (Daily runtime in minutes * Application efficiency). Drip irrigation application efficiency is 90% for well-designed systems, per IA standards. The two flow calculations should match within 5%; if not, check emitter spacing or runtime assumptions.
- Add a 10% safety factor for minor leaks, emitter wear, and small flow variations. NRCS warns against adding more than 15% safety factor, as data shows higher factors increase energy use by 22% on average by pushing pumps off their BEP.
Step 2: Calculate Total Dynamic Head (TDH)
TDH is the sum of seven separate pressure components, many of which are overlooked in rough sizing estimates. Calculate each to the nearest foot, using published pipe and component friction loss tables:
- Static suction lift/head: Vertical distance from the lowest expected water source level (including well drawdown during peak pumping) to the pump centerline. If the pump is above the water source, this is lift (added to TDH); if the pump is below the water level (submersible, flooded suction), this is head (subtracted from TDH).
- Static discharge elevation: Vertical distance from the pump centerline to the highest point in the drip system, measured at the farthest emitter from the pump.
- Suction side friction loss: Pressure lost to friction in suction piping, foot valves, strainers, and fittings. Keep suction line velocity below 5 ft per second to minimize loss and cavitation risk. For example, 4-inch schedule 40 PVC has a friction loss of 1.95 ft per 100 ft at 200 gpm.
- Discharge side friction loss: Pressure lost to friction in mainline and submain piping, zone valves, elbows, and tees. Keep discharge line velocity below 7 ft per second to reduce water hammer risk.
- System component friction loss: Pressure lost to filters, backflow preventers, fertigation injectors, flow meters, and pressure regulators. Always use the maximum dirty filter pressure drop (typically 7-10 psi for media filters, 3-5 psi for disc/screen filters) rather than clean pressure drop, as filters load with debris between backwash cycles. Pressure regulators typically add 5-7 psi of loss, which is frequently omitted from rough calculations.
- Rated emitter operating pressure: Minimum pressure required for emitters to deliver rated flow: 10-15 psi for non-pressure-compensating drip tape, 15-20 psi for pressure-compensating emitters, 20-30 psi for subsurface drip emitters in heavy soils.
- Lateral friction loss: Pressure lost along drip lateral lines between the submain and the farthest emitter. Well-designed laterals keep this loss below 10% of emitter operating pressure (e.g., 1.5 psi = 3.5 ft for 15 psi emitters), per NRCS standards.
Step 3: Match Flow and TDH to Manufacturer Pump Curves
Once design flow and TDH are calculated, compare values to published pump performance curves, which plot flow against TDH, efficiency, brake horsepower (BHP), and NPSHr for each impeller size. Prioritize pumps where the design operating point falls within 5% of the BEP, and confirm that NPSHa (calculated as atmospheric pressure minus suction lift, minus suction friction loss, minus water vapor pressure for local water temperature) is at least 2 ft above the pump’s NPSHr. HI research shows pumps operated within 10% of BEP have a 45% longer service life than units operated 20% or more from BEP.
Step 4: Adjust for Site-Specific Variables
Base calculations do not always account for site-specific conditions that alter pump requirements:
- Well drawdown: U.S. Geological Survey (USGS) 2023 data from the High Plains Aquifer shows 28% of irrigation wells experience 10-30 ft of additional drawdown after 5 years of pumping as aquifer levels decline. Always use the 10-year projected low pumping level, not the static water level measured when the pump is off, to calculate suction lift.
- Elevation and temperature: At elevations above 3,000 ft, atmospheric pressure drops by 1 ft per 1,000 ft of elevation gain, reducing maximum suction lift. Water temperatures above 85°F (common in shallow summer ponds) increase vapor pressure, raising NPSHr requirements by 1-3 ft.
- Future expansion: If adding 20% or more acreage in the next 5 years, size the pump to meet future flow requirements, but install a variable frequency drive (VFD) to reduce speed during current low-flow operation, rather than running an oversized fixed-speed pump with a throttled valve. USDA NRCS 2024 data shows VFDs reduce energy use by 20-35% for variable-flow drip systems.
Which Pump Type Is Best for Drip Irrigation Applications?
There is no one-size-fits-all pump for drip systems; the correct type depends on water source, flow, TDH, and power source. Common options include:
- End-suction centrifugal pumps: The most common choice for surface water sources (canals, ponds) with less than 15 ft of suction lift, available in 1-50 HP models for 10-1,000 gpm flow ranges, with BEP efficiencies of 70-82%. These require flooded suction or priming systems for lifts above 10 ft.
- Submersible turbine pumps: Installed below water level in wells, eliminating suction lift limitations. Ideal for wells with 20+ ft of drawdown, available in 2-100 HP models for 5-2,000 gpm flow ranges, with BEP efficiencies of 72-84%.
- Horizontal split-case centrifugal pumps: Used for large-scale drip systems (100+ acres) with flow rates above 500 gpm, with BEP efficiencies of 80-86% and longer service life than end-suction models for high-flow applications.
- Booster pumps: Used to add pressure for zones at high elevation or when connecting a drip system to a low-pressure municipal or canal supply, sized for the specific flow and pressure deficit of the zone.
- Solar-powered centrifugal/turbine pumps: Growing in popularity for off-grid drip systems, with 2023 International Water Management Institute (IWMI) data showing correctly sized solar pumps reduce energy costs by 90% compared to diesel pumps. Critically, 47% of solar drip installations are undersized because installers size based on panel wattage rather than peak TDH and flow requirements during low-sunlight periods.
Pump Sizing Comparison for Common Drip Irrigation Scenarios
The table below compares correctly sized pump specifications, costs, and common sizing errors across three typical farm operations, using 2024 equipment pricing, $0.12/kWh electricity costs, and NRCS design standards:
| System Scenario | Peak Design Flow (GPM) | Total Dynamic Head (Feet) | Recommended Pump Type | BEP Efficiency (%) | Estimated Annual Energy Cost | Most Frequent Sizing Error | 10-Year Cost of Sizing Error |
|---|---|---|---|---|---|---|---|
| 5-acre diversified vegetable farm, surface drip with 0.5 gph emitters (1ft x 3ft spacing), 12-hour daily runtime, shallow well with 10 ft static lift | 68 | 112 (10 ft lift, 22 ft friction loss, 80 ft emitter pressure/component loss) | 1.5 HP end-suction centrifugal pump | 72 | $415 | Oversizing to 100 GPM / 150 ft TDH (3 HP pump) for "extra pressure" | $3,280 in excess energy costs + $1,200 in premature emitter/filter maintenance = $4,480 |
| 40-acre mature almond orchard, subsurface drip with 1 gph pressure-compensating emitters (2ft x 12ft spacing), 18-hour daily runtime, canal water source with 15 ft lift, 35 ft cross-field slope | 445 | 158 (15 ft lift, 48 ft piping/filter friction loss, 95 ft emitter pressure/elevation loss) | 25 HP horizontal split-case centrifugal pump with VFD | 82 | $4,720 | Undersizing to 350 GPM / 130 ft TDH (20 HP pump) to cut upfront costs | $12,700 in lost yield from 72% distribution uniformity + $2,900 in cavitation-related pump repairs = $15,600 |
| 160-acre processing tomato field, drip tape with 0.22 gph emitters (1ft x 5ft spacing), 22-hour daily runtime, groundwater well with 25 ft drawdown | 1,280 | 196 (55 ft total lift with drawdown, 61 ft piping/filter friction, 80 ft emitter/lateral loss) | 75 HP vertical turbine pump with VFD | 84 | $18,100 | Oversizing to 1,600 GPM / 230 ft TDH (100 HP pump) for unplanned future expansion without VFD | $27,400 in excess energy costs + $8,300 in water hammer-related tubing blowouts/repairs = $35,700 |
Real-World Pump Sizing Example: 10-Acre Highbush Blueberry Farm
To demonstrate how the sizing process works in practice, consider a 10-acre certified organic highbush blueberry farm in western Oregon, with a 10-year average July peak ETc of 0.22 inches per day (AgriMet data). The system uses surface drip with 0.5 gph pressure-compensating emitters spaced 2 ft apart, with one drip line per row on 10 ft row spacing. The farm is split into 8 equal irrigation zones (1.25 acres per zone) to match the 80 gpm certified yield of their on-site well. The well has a static water level 20 ft below ground, with 18 ft of drawdown at peak 45 gpm flow, leading to a lowest expected pumping level of 38 ft below ground level where a surface pump would be mounted. The field has a 12 ft gentle slope, with the highest corner located 600 ft from the pump location. The farm’s irrigation schedule calls for 7 hours of runtime per two-zone cycle, for 14 total hours of daily runtime during peak ET to cover all 8 zones.
Step 1: Flow Calculation
Each 1.25 acre zone covers 54,450 sq ft, with 2,723 emitters (one per 20 sq ft of zone area, based on 2ft x 10ft spacing). Total emitter flow for two zones running simultaneously is 2,723 * 0.5 gph * 2 zones = 2,723 gph = 45.4 gpm. Cross-verified with the ET formula: Q = (108,900 sq ft for two zones * 0.22 in/day * 0.623 gal/sq ft/in) / (420 minutes runtime per cycle * 0.9 application efficiency) = 39.4 gpm. The 13% difference comes from extra flow needed to compensate for slight emitter manufacturing variability, so a 10% safety factor is added to the emitter-based flow calculation for a total design flow of 50 gpm, which stays within the well’s 80 gpm yield limit.
Step 2: TDH and NPSH Calculation
Initially, the farm owner planned to use a 2 HP surface end-suction pump left over from a previous sprinkler system, rated for 50 gpm at 150 ft TDH. But when calculating TDH and NPSHa, a critical issue emerged:
- Static suction lift was 38 ft to the lowest pumping level, which exceeds the theoretical maximum 33.9 ft suction lift at sea level. Calculated NPSHa for the surface pump was -8.9 ft, meaning cavitation would be immediate and catastrophic, even with priming.
- The design was revised to use a 2 HP submersible turbine pump set 50 ft below ground level (12 ft below the lowest pumping level) to eliminate suction lift issues. TDH for the submersible pump was calculated as: 50 ft vertical lift from pump to ground level + 12 ft elevation gain to the high field corner + 2.1 ft drop pipe friction + 6.4 ft mainline friction (3 inch PVC, 600 ft length) + 43 ft component loss (disc filter, backflow preventer, injector, pressure regulators, using maximum 7 psi dirty filter drop) + 34.7 ft (15 psi) emitter operating pressure + 3.5 ft lateral friction loss = 151.7 ft TDH, rounded up to 155 ft.
- NPSHa for the submersible pump was calculated as 12 ft of submergence minus 2.1 ft of drop pipe friction minus 0.6 ft water vapor pressure (for 60°F groundwater) = 9.3 ft, which is 2.3 ft above the selected pump’s 7 ft NPSHr, meeting HI safety standards.
Post-Installation Results
The farm initially installed the old 2 HP surface pump before completing formal calculations, assuming it would work. After three weeks of operation, the pump showed classic cavitation symptoms: loud rattling, 30% reduced flow, and pressure dropping to 7 psi at the farthest emitters. Service technicians found 25% erosion on the brass impeller, requiring $480 in repairs. After switching to the correctly sized submersible pump, system DU measured 91% (up from 62% with the mismatched pump), average berry weight increased by 22% in the first harvest season, and annual energy costs dropped by $210 compared to the surface pump. The farm’s $1,800 investment in the correct pump delivered $7,900 in increased revenue in the first year alone, from higher yield and reduced cull rates.
Most Common Pump Sizing Mistakes to Avoid
A 2023 IA survey of 1,200 irrigation designers and growers identified the following recurring sizing errors, which account for 82% of drip pump performance issues:
- Overapplying safety factors: 62% of growers add a 25%+ safety factor to both flow and TDH, leading to pumps operating at 40-60% of BEP with 35% higher energy costs. Safety factors above 10-15% are never justified without planned, near-term expansion paired with a VFD.
- Using clean filter pressure drop instead of dirty drop: 41% of sizing calculations use clean filter pressure loss, ignoring the 5-10 psi pressure increase as filters load with sediment. This leads to 5-10 psi low pressure in the 2-3 days before backwash cycles, reducing DU by 12-18% during that period.
- Forgetting regulator and component loss: 37% of rough sizing estimates omit pressure loss from regulators, backflow preventers, and injectors, which add 10-20 psi of total head requirement. This is the leading cause of undersized pumps in small-scale farm drip systems.
- Ignoring well drawdown: As noted in USGS data, 28% of well-based systems experience increased drawdown over time, leading to 15% lower flow than design within 5 years. Always size pumps using the 10-year projected low water level, not initial static water levels.
- Sizing by horsepower instead of flow and head: Horsepower is a function of flow, head, and efficiency, not a standalone metric. A 5 HP pump from one manufacturer may deliver 50 gpm at 150 ft TDH, while a high-efficiency 3 HP pump from another may deliver the same flow and head at 25% lower energy cost.
Post-Installation Validation to Confirm Correct Sizing
Even the most thorough calculations require field validation after installation to catch errors from pipe friction estimates, component performance, or site conditions. NRCS recommends running four tests within 72 hours of pump startup:
- Flow test: Use a calibrated in-line flow meter to measure flow at design pressure, comparing to calculated design flow. Flow should be within +/-5% of the design value. If flow is more than 20% high, the pump is oversized; if more than 10% low, check for clogged filters, closed valves, or air locks before assuming undersizing.
- Pressure survey: Measure pressure at the pump discharge, filter inlet and outlet, farthest zone valve, and last emitter on the farthest lateral. Pressure at the last emitter should be within 10% of the rated emitter operating pressure (e.g., 13.5-16.5 psi for 15 psi emitters).
- Efficiency test: Measure electrical power draw (or diesel fuel consumption) at design flow, comparing to the manufacturer’s published BHP at the operating point. Efficiency should be within 5% of the published BEP efficiency.
- Cavitation check: Listen for a rattling, marble-like noise at the pump suction, and measure suction pressure to confirm NPSHa is at least 2 ft above NPSHr. If cavitation is present, increase suction pipe diameter, reduce suction lift, or lower the pump to increase submergence.
For existing pumps found to be oversized, impeller trimming can reduce energy use by 10-20% at a fraction of the cost of pump replacement, per HI data. For oversized pumps with highly variable flow requirements, retrofitting a VFD delivers 20-35% energy savings, with many utilities offering rebates covering 30-50% of installation costs. For undersized pumps, first identify if pressure losses are from clogged filters, undersized piping, or partially closed valves before replacing the pump; 22% of "undersized" pump reports are actually caused by unaddressed friction loss in components, per 2024 irrigation service data from Rain Bird. When sized correctly, drip irrigation pumps deliver consistent pressure, uniform water distribution, and decades of reliable service with minimal energy and maintenance costs, making the upfront time invested in proper calculations one of the highest-return decisions for any drip system installation.