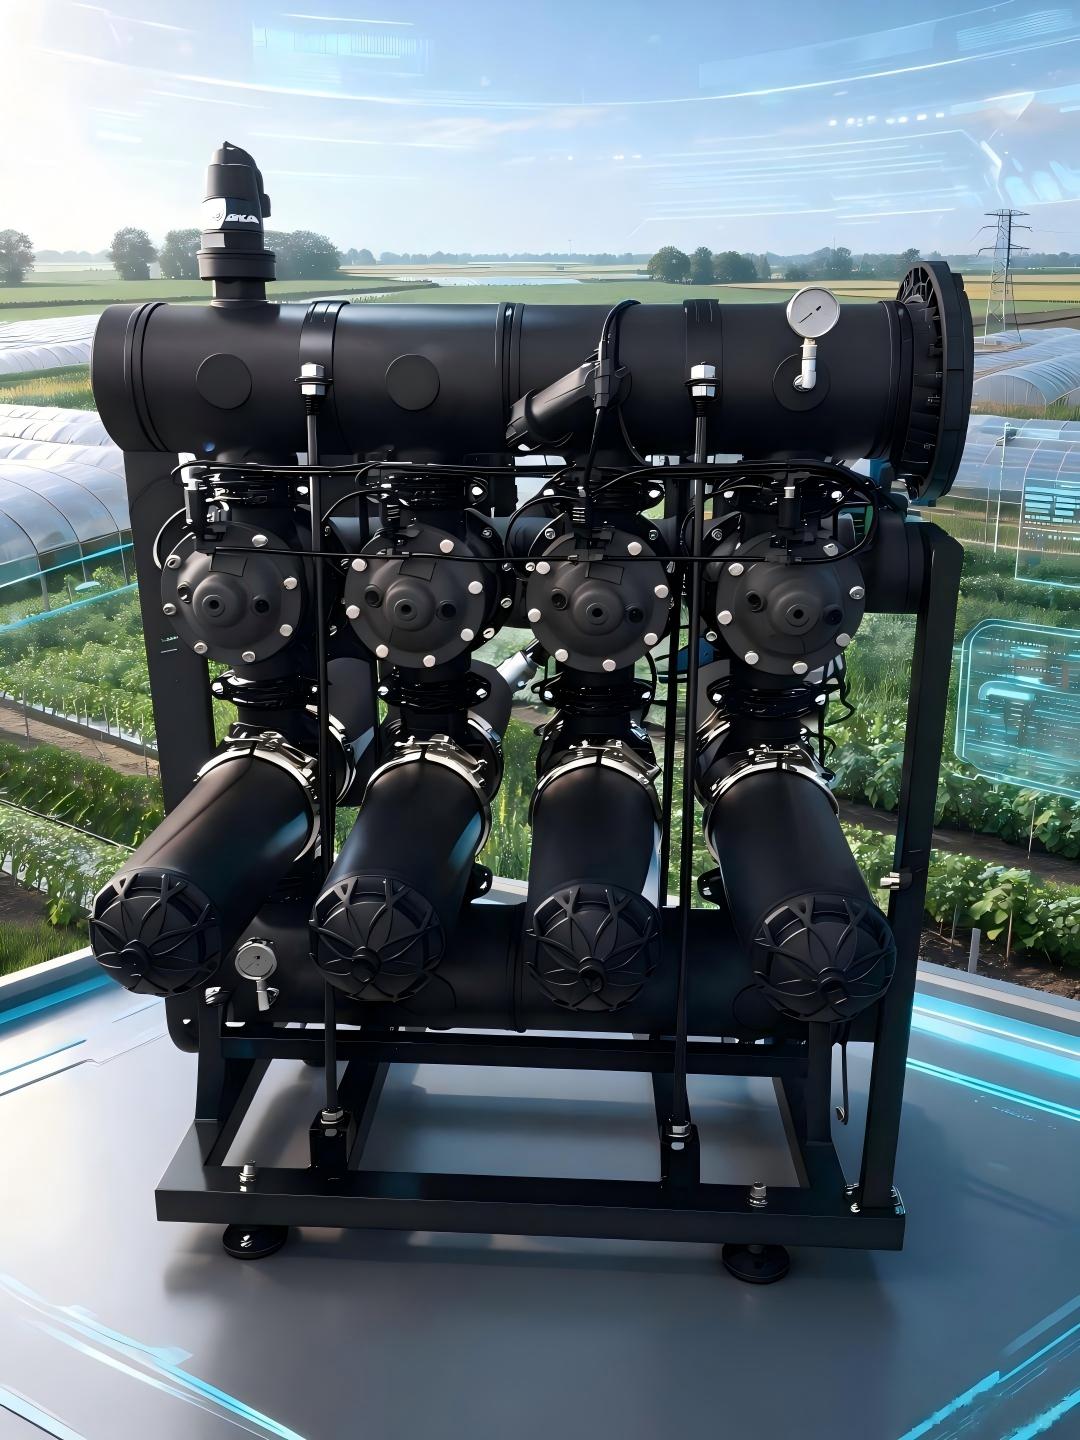
Irrigation Flow Meter Installation: A Complete Guide for Agricultural Operations
The Food and Agriculture Organization (FAO) estimates that 70% of global freshwater withdrawals support agricultural irrigation, yet up to 40% of that water is lost to leaks, overwatering, and unmeasured flow due to missing or incorrectly installed flow meters. For U.S. farmers alone, that waste translates to $2.7 billion annually in unnecessary pumping costs, fertilizer leaching, and lost crop yield, per 2024 USDA Economic Research Service (ERS) data. Proper irrigation flow meter installation is no longer a niche technical task: it is a core component of profitable, regulatory-compliant, and sustainable farm operation. Unlike residential or commercial flow meters, agricultural irrigation meters operate in harsh conditions—with sediment, fertilizer chemicals, fluctuating pressures, and variable flow rates—that make correct siting, mounting, and calibration critical to long-term accuracy. This guide breaks down every step of planning, installing, calibrating, and maintaining irrigation flow meters, with verified field data, cost calculations, side-by-side equipment comparisons, and real farm examples to ensure maximum return on investment.
Why Proper Irrigation Flow Meter Installation Is Non-Negotiable for Modern Agriculture
Even the highest-quality, most expensive flow meter will deliver inaccurate, unreliable data if installed incorrectly. Field audits from the Irrigation Association show that poorly installed meters have measurement errors ranging from 15% to 50%, which negates all potential benefits of metering. The tangible, quantified benefits of correct installation fall into three core categories:
Quantifiable Water and Cost Savings From Correctly Installed Meters
A 2023 USDA Natural Resources Conservation Service (NRCS) study of 780 farms across 12 states found that operations with properly installed, calibrated flow meters reduced irrigation water use by 22% on average, cutting annual pumping costs by $127 per acre for corn operations in the Corn Belt and $213 per acre for alfalfa operations in the Intermountain West. These savings come from eliminating hidden leaks, reducing overwatering, and matching application rates exactly to crop evapotranspiration (ET) requirements. For a 200-acre corn farm, that equals $25,400 in annual pumping cost savings alone, before accounting for reduced fertilizer leaching or improved yields.
Regulatory and Conservation Incentive Compliance
As of 2024, 17 Western U.S. states require agricultural water users to install flow meters with ±5% or better accuracy on all diversions over 100 gallons per minute (gpm), per National Agricultural Statistics Service (NASS) data. The Western Governors’ Association reports that 38% of agricultural operations in these states faced water allocation penalties in 2022 due to unmeasured or inaccurately metered diversions, with fines averaging $1,200 per violation and temporary water allocation cuts of 10% for repeat offenses. Properly installed meters also qualify farms for NRCS Environmental Quality Incentives Program (EQIP) cost-share payments, which cover 60-90% of total meter and installation costs for operations implementing water conservation practices. In 2023, EQIP paid out $42 million in agricultural metering cost shares nationwide.
Crop Yield Protection From Over/Under Watering
University of Nebraska-Lincoln (UNL) Extension trials show that irrigation application errors of just 10% during critical crop growth stages (corn tasseling, soybean pod fill, pecan nut fill) reduce yields by 8-15% on average. Correctly installed meters deliver real-time flow data that allows farmers to apply water with 1-2% accuracy, eliminating the under-watering that causes yield loss and the overwatering that triggers root rot, nutrient leaching, and disease pressure. For high-value specialty crops, that yield protection translates to $500-$1,200 per acre in annual revenue retention.
Pre-Installation Planning: Critical Steps to Avoid Costly Mistakes
Industry data shows that 70% of flow meter performance issues trace back to poor pre-installation planning, rather than equipment defects. Taking time to assess site conditions, select the right meter for the application, and size the unit correctly prevents 90% of post-installation accuracy problems, per 2024 Flow Research Inc. field data.
Site Assessment and Hydraulic Profile Mapping
The first step in any installation is mapping the hydraulic profile of the irrigation line or open channel to identify a stable, low-turbulence site for the meter. All flow meters require a minimum length of straight, unobstructed pipe upstream and downstream of the unit to eliminate turbulence that skews readings. A 2024 Irrigation Association field audit of 450 agricultural meters found that 62% of accuracy errors stemmed from inadequate straight pipe runs at installation, leading to 15-30% measurement drift. Before selecting an installation site, complete the following mandatory checks, aligned with American Water Works Association (AWWA) C700 standards for agricultural metering:
- Map all hydraulic disturbances within 50 feet of the potential site, including 90-degree elbows, tees, gate valves, pump discharges, chemical injection ports, pipe diameter changes, and free-falling water discharges. Each disturbance creates turbulence that requires additional straight pipe length to dissipate.
- Avoid pipe high points where air can become trapped, as air entrainment causes 30-50% over-reading in most meter types. The ideal site is on a straight, horizontal section of pipe, or a vertical section with upward flow to keep the meter body fully pressurized and free of air.
- Verify that the site will remain fully flooded during minimum flow rates: for open channel meters, this means ensuring the sensor is mounted above silt accumulation levels but below minimum water elevation; for in-pipe meters, this means avoiding sections of line that drain partially during low-flow irrigation sets.
- Confirm 24 inches of clear access around all sides of the meter for future maintenance, calibration, and repairs. Field data shows 60% of farmers skip required annual calibration when meters are buried too deep, blocked by pipe fittings, or located under heavy vegetation.
- For digital meters, confirm the site is at least 12 inches away from variable frequency drive (VFD) power cables, electric motors, or radio transmitters to avoid electromagnetic interference that disrupts sensor signals.
Selecting the Right Meter Type for Your Irrigation System
There is no one-size-fits-all irrigation flow meter: each type is designed for specific water quality conditions, pipe sizes, flow ranges, and installation constraints. Selecting the wrong meter for the application will lead to premature failure and inaccurate readings, even with perfect installation. The table below compares the most common agricultural irrigation meter types, with field-verified performance data for 4-8 inch pipe systems (the most common size for mid-sized farm operations):
| Meter Type | Primary Agricultural Use Cases | Required Straight Pipe (Upstream / Downstream, multiples of pipe diameter) | Factory Accuracy Rating | Installation Difficulty (1=easiest, 5=hardest) | Typical Installed Cost Range (4-8 inch pipe) | Expected Service Life | Required Maintenance Frequency |
|---|---|---|---|---|---|---|---|
| Electromagnetic (Mag) Meter | Center pivots, chemigation lines, systems with sediment/fertilizer in water, groundwater wells | 5D / 3D | ±0.5% of reading | 3/5 | $1,800 - $4,200 | 15-20 years | Annual visual inspection, calibration every 3-5 years |
| Clamp-On Ultrasonic Meter | Retrofit installations, above-ground aluminum lines, systems where flow interruption is not possible, temporary monitoring | 10D / 5D | ±1-2% of reading | 1/5 | $1,200 - $3,800 | 10-15 years | Bi-annual signal strength check, calibration every 2-3 years |
| Inline Turbine Meter | Drip/micro irrigation, clean groundwater systems, small to mid-sized solid set sprinklers | 10D / 5D | ±1-2% of reading | 3/5 | $800 - $2,100 | 8-12 years | Quarterly debris check, annual impeller inspection, calibration every 1-2 years |
| Propeller (Impeller) Meter | Open canal turnouts, large-diameter pipeline surface irrigation, flood irrigation systems | 5D / 2D (in-pipe); stilling well required for open channel | ±2-3% of reading | 2/5 | $900 - $2,700 | 10-12 years | Semi-annual debris removal, calibration every 1-2 years |
| Positive Displacement (PD) Meter | Small-acreage high-value crops, nursery irrigation, chemigation injection monitoring, low-flow drip | 3D / 2D | ±0.5-1% of reading | 4/5 | $500 - $1,600 | 5-8 years | Monthly seal wear check, annual calibration |
| Open Channel Ultrasonic Meter | Earthen ditches, large canal turnouts, tailwater recovery systems | 20D / 5D (open channel approach length) | ±2-4% of reading | 2/5 | $2,500 - $7,000 | 10-12 years | Annual sensor cleaning, calibration every 2 years |
Sizing the Meter Correctly to Avoid Accuracy Drift
Even if you select the correct meter type and site, an incorrectly sized unit will deliver inaccurate readings and cause unnecessary pressure loss. Meters are sized to operate most accurately when flow falls between 20% and 80% of the unit’s maximum rated flow range, per manufacturer specifications. UNL Extension data shows that meters sized two times larger than required have 18% higher measurement error at low flow rates (common during germination irrigations or partial zone runs), while undersized meters cause 7+ psi of pressure loss, reducing center pivot end pressure by 12% on average and leading to uneven water distribution across the field. To size a meter correctly:
- Calculate the minimum and maximum expected flow rates for the system: for center pivots, this is the pump output at lowest and highest operating pressures; for drip systems, this is the flow when one small zone is running and when all zones are active; for canal turnouts, this is the minimum late-season flow and maximum flood irrigation flow.
- Select a meter where the full range of expected flows falls between the 20% and 80% mark of the meter’s rated flow range, rather than matching the meter size exactly to the pipe diameter. In many cases, a smaller meter with reducer flanges will deliver better accuracy than a large meter operating below its 20% flow threshold.
- Calculate pressure loss across the meter at maximum flow: for sprinkler and drip systems, pressure loss should not exceed 3 psi to avoid reducing application uniformity; for flood and surface irrigation systems, pressure loss up to 5 psi is acceptable.
Practical example: A 160-acre corn farm in central Iowa operates a center pivot on an 8-inch PVC supply line, with flow rates ranging from 300 gpm (during end-gun only germination sets) to 1,200 gpm (during full pivot operation in peak ET). An 8-inch mag meter rated for 200-1,500 gpm is the correct size, as the 300 gpm minimum flow is 20% of the meter’s maximum rating, and the 1,200 gpm peak flow is 80% of the maximum rating. A 10-inch mag meter (matching the largest pipe size on the farm) would be oversized, with 300 gpm falling at just 12% of its rated range, leading to 18% low-flow error.
Step-by-Step Irrigation Flow Meter Installation Process for Common System Types
Installation processes vary by meter type and system configuration, but following manufacturer specifications and industry standards ensures long-term accuracy. Below are field-tested installation protocols for the three most common agricultural irrigation metering scenarios, with real farm examples to illustrate best practices.
In-Pipe Spigot/Flanged Meter Installation (Permanent, Buried Lines)
In-pipe meters (mag, turbine, PD, propeller) are the most common installations for permanent groundwater well and buried pipeline systems. Follow these steps for a leak-free, accurate installation:
- Isolate the pipe section, drain all pressure, and cut the pipe to the length specified by the meter manufacturer, leaving enough space for flanges, gaskets, and upstream/downstream straight pipe runs.
- For turbine and PD meters, install a 20-mesh strainer 5 pipe diameters upstream of the meter to catch sand, crop residue, and debris that can damage moving parts. Badger Meter warranty data shows that installing a strainer reduces impeller damage by 89%, extending turbine meter service life by 6 years on average.
- Align the meter with the pipe, ensuring the embossed flow direction arrow on the meter body points in the direction of water flow. The Irrigation Association reports that 17% of self-installed meters are mounted backward, leading to zero or negative flow readings and potential water rights fraud penalties in regulated states.
- Install EPDM rubber gaskets rated for 150 psi (standard for agricultural irrigation) between flanges, and tighten bolts evenly in a star pattern to avoid uneven pressure that causes leaks or cracks the meter body.
- For mag meters, install copper grounding wires between the meter and adjacent pipe sections on both upstream and downstream sides, per manufacturer specifications. Poor grounding is the leading cause of mag meter error, as electrical interference from VFD pump motors can cause 20%+ reading spikes when the meter is not properly grounded.
- Install an air vent valve at the highest pipe point within 10 feet upstream of the meter to bleed trapped air that causes over-reading.
- Repressurize the line slowly, checking for leaks at flange connections, then bleed all air from the meter body before activating the digital transmitter.
Practical farm example: The 160-acre Iowa corn farm referenced earlier installed an 8-inch mag meter on their center pivot supply line in spring 2023. The crew selected a site 40 inches (5x 8-inch diameter) upstream from the pivot elbow and 24 inches (3x) downstream from the last chemical injection tee, meeting the meter’s straight pipe requirements. They installed a 20-mesh strainer 40 inches upstream of the meter, connected grounding wires to the PVC pipe’s steel reinforcing bands, and mounted the transmitter 3 feet above ground level to avoid flood damage during heavy spring rains. After repressurizing, they bled air from the line and tested readings against a calibrated portable ultrasonic meter, finding accuracy within 0.4% across all flow rates.
Clamp-On Ultrasonic Meter Installation (Retrofit, No Flow Interruption)
Clamp-on ultrasonic meters are ideal for retrofits on existing lines during the growing season, as they require no pipe cutting or flow interruption. Follow these steps for accurate readings:
- Select a site meeting the 10D upstream / 5D downstream straight pipe requirement, on a section of pipe with no external rust, paint, or dents that block acoustic signals.
- Sand the pipe surface at the transducer mounting location to bare metal (for aluminum/steel pipe) or smooth PVC, then apply a 1/8-inch thick layer of acoustic coupling gel to eliminate air gaps between the transducer and pipe wall.
- Mount the transducers at the exact spacing specified by the manufacturer for your pipe material, diameter, and wall thickness, then secure the mounting bracket with stainless steel straps to avoid movement from pipe vibration.
- Input pipe parameters (material, wall thickness, fluid temperature, expected flow range) into the meter transmitter, then verify signal strength is at least 90%. Signal strength below 70% leads to 8-15% measurement error, typically caused by dried coupling gel or poorly positioned transducers.
- Secure the transmitter cable to the pipe with weather-resistant cable ties, running it at least 12 inches away from VFD and power cables to avoid interference.
Practical farm example: A 40-acre organic vegetable farm in California’s Central Valley needed to meter their 6-inch above-ground aluminum drip mainline in July 2023, during peak tomato harvest when shutting down irrigation would have caused $18,000 in crop loss. The farm selected a clamp-on ultrasonic meter, choosing a site 60 inches (10x 6-inch diameter) upstream of the first zone valve and 30 inches (5x) downstream from the pump discharge. After sanding the pipe surface and applying coupling gel, the crew mounted transducers at the specified 3.2-inch spacing, verified 94% signal strength, and connected the meter to their smart irrigation controller. The full installation took 2.5 hours with no flow interruption, and post-installation testing found readings within 1.2% of calibrated values.
Canal/Open Ditch Flow Meter Installation (Surface Irrigation Turnouts)
Open channel and propeller meters for canal and ditch turnouts require stable flow conditions to avoid errors from wave action and turbulence. Follow these steps:
- Install a concrete or metal stilling well at the turnout location to dampen wave action and create a uniform flow profile. The stilling well should be sized so water velocity through the well does not exceed 1.5 feet per second at maximum flow.
- Mount the meter sensor so it is fully submerged at minimum flow (at least 6 inches of water above the sensor for propeller meters, 12 inches above the water surface for ultrasonic open channel meters) and above the expected silt accumulation line at the ditch bottom.
- Mount the data logger and transmitter 4 feet above the 100-year flood elevation for the canal, to avoid water damage during high flow events.
- Clear debris and vegetation from 20 feet upstream and 5 feet downstream of the meter to eliminate flow obstructions that cause turbulence.
Practical farm example: A 200-acre alfalfa farm in southern Idaho installed a propeller meter at their concrete turnout from the Snake River canal system in spring 2024. The crew built a 3-foot wide stilling well at the turnout, set the propeller 8 inches above the ditch bottom to avoid silt buildup, and mounted the logger 5 feet above the canal’s high water mark. They calibrated the meter against the canal company’s official staff gauge over three consecutive 12-hour irrigation sets, finding accuracy within 2.1% of measured flow, which met Idaho Department of Water Resources metering requirements.
Post-Installation Calibration and Initial Testing
No installation is complete without calibration to verify accuracy under real operating conditions. All meters require a post-installation accuracy check within 30 days of installation to qualify for EQIP cost shares and state regulatory compliance. Follow these testing steps:
- Test accuracy at three flow rates: minimum expected flow (germination/small zone runs), average operating flow (peak ET irrigation sets), and maximum flow (full system operation). For each test, compare meter readings to a calibrated reference: a portable ultrasonic meter for pipelines, a staff gauge and velocity meter for open channels, or a calibrated bucket/tank test for small low-flow systems.
- Accuracy should fall within the meter’s rated range (e.g., ±0.5% for mag meters, ±2% for propeller meters). If readings are off by more than 3%, check for straight pipe violations, trapped air, poor grounding, or incorrect transducer positioning before re-testing.
- Record baseline calibration readings and file them with your water rights records, as most states require proof of calibration during compliance audits.
Common Installation Errors and Their Measurable Impacts on Performance
Even small installation mistakes can lead to thousands of dollars in wasted water, lost yield, and regulatory penalties. The most common errors, documented in thousands of field audits, have predictable, measurable impacts:
Straight Pipe Run Violations
Installing a meter too close to elbows, valves, or tees creates swirling turbulence that distorts flow profiles across the meter sensor. For example, installing a turbine meter immediately downstream of a 90-degree elbow can spin the impeller 25% faster than actual flow, leading to 20% overestimation of water applied. For a 200-acre corn farm, that error would lead to under-watering during tasseling, costing $9,600 in lost yield at 2024 corn prices, per Kansas State (K-State) Extension data.
Air Entrainment and Cavitation
Installing a meter at a pipe high point, downstream of a free-falling discharge, or without an upstream air vent allows air bubbles to enter the meter body. For mag meters, air bubbles disrupt the magnetic field, causing 30-50% higher flow readings than actual. A 2022 K-State audit of 120 center pivot meters in western Kansas found that 28% of mag meters were installed at pipe high points, leading to an average 27% overestimation of flow and a 12 bushel per acre yield loss from under-watering. Cavitation, caused by low pressure at the meter inlet, creates vapor bubbles that erode meter components and cause 10-20% low readings over time.
Electrical Interference and Miswiring
Running meter signal cables within 12 inches of VFD power cables or electric motors creates electromagnetic interference that causes random reading spikes, leading to 10-15% data inaccuracy, per 2023 Irrigation Innovation Consortium research. Miswiring—such as reversing power supply polarity or connecting signal wires to the wrong terminals—fries digital transmitters in 12% of self-installed meters, leading to $400-$1,200 in replacement costs not covered by manufacturer warranties.
Poor Mounting Orientation and Access Gaps
Installing a turbine or PD meter facing downward on a vertical pipe allows sediment to settle in the meter body, wearing bearings three times faster than normal and reducing service life from 10 years to 3 years. Meters installed without adequate access for maintenance are 60% less likely to receive required annual calibration, leading to gradual accuracy drift of 2-5% per year as components wear.
Post-Installation Long-Term Maintenance to Preserve Accuracy
A properly installed meter will only remain accurate if maintained on a schedule aligned with its design and operating conditions. Maintenance requirements vary by meter type, as outlined below:
- Electromagnetic meters: Conduct annual visual inspections for liner damage, ground wire corrosion, and water in the transmitter housing; calibrate every 3-5 years. Flow Research Inc. data shows 98% of properly maintained mag meters retain ±1% accuracy over 15 years of service.
- Turbine/propeller meters: Conduct quarterly inspections for impeller debris buildup, which causes 12-20% low flow readings; inspect impeller bearings for wear annually; calibrate every 1-2 years.
- Clamp-on ultrasonic meters: Check transducer signal strength and coupling gel condition every 6 months, as dried gel causes 41% of clamp-on meter errors by reducing signal strength below 70%; calibrate every 2-3 years.
- Positive displacement meters: Conduct monthly checks for internal seal wear, which allows water to bypass the measuring chamber and cause 5-10% measurement error; calibrate annually.
Practical farm example: A 300-acre pecan orchard in southern Georgia installed six turbine flow meters on their micro-sprinkler system in 2019. Initially, the farm skipped quarterly maintenance, and by 2021, fine sand from their well water had built up on the meter impellers, causing readings to run 18% low. The farm applied 18% more water than needed during the 2021 pecan nut fill stage, leading to 2 inches of deep percolation that leached $12,000 worth of applied nitrogen below the root zone and increased Phytophthora root rot risk in 12% of trees. After implementing quarterly debris checks and annual calibration, the farm reduced water use by 19% in 2022, cut fertilizer costs by $38 per acre, and increased pecan yields by 7% due to more consistent soil moisture, generating $29,400 in additional annual revenue.
For maximum benefit, integrate installed meters with smart irrigation controllers and soil moisture sensors. 2023 USDA Sustainable Agriculture Research and Education (SARE) trials show that connected meter systems reduce water use by an additional 14% compared to manually read meters, by automatically adjusting irrigation run times based on real-time flow data and soil moisture levels.
Installation Cost Breakdown and ROI Calculations
The cost of irrigation flow meter installation varies by meter type, pipe size, and site conditions, but the return on investment is consistently fast for operations of all sizes.
Upfront Cost Components
For all meter types, total installed cost breaks down into four core components:
- Meter unit and accessories (transmitter, cables, mounting hardware): 25-30% of total cost
- Labor, pipe fittings, gaskets, and site preparation (e.g., stilling well construction, valve box installation): 40-50% of total cost
- Calibration and data logger/smart controller integration: 10-15% of total cost
- Permits, inspection fees, and third-party verification for water rights compliance: 10% of total cost
Average Installation Costs By Farm Size
Based on 2024 Irrigation Association cost survey data, average total installed costs are:
- Small farms (<40 acres, drip/micro irrigation, 2-4 inch pipe): $600-$1,500 per meter, with 2-4 hours of labor for a two-person crew
- Mid-sized farms (40-200 acres, center pivot/solid set sprinklers, 6-10 inch pipe): $1,800-$4,500 per meter, with 4-8 hours of labor
- Large farms (>200 acres, canal turnouts/large diameter pipelines, 12+ inch pipe): $4,000-$12,000 per meter, with 8-16 hours of labor including stilling well construction
Real-World ROI Examples
Example 1: 200-acre corn/soy farm in Nebraska, installing one 8-inch mag meter on a center pivot supply line for a total cost of $2,700. Annual benefits include: $231 in pumping cost savings from 22% reduced water use, $1,140 in fertilizer savings from reduced nitrogen leaching, and $1,200 in avoided water right penalties. The farm also received an $1,800 EQIP cost-share payment. Total first-year net benefit: $3,671, leading to a payback period of 0.2 years (2.5 months) with cost share, or 1.1 years without cost share.
Example 2: 40-acre organic vegetable farm in California, installing a 6-inch clamp-on ultrasonic meter for a total cost of $1,900. Annual benefits include: $1,200 in water cost savings from 25% reduced use, $3,200 in reduced crop loss from root rot, and $1,500 in annual revenue from selling 2 acre-feet of unused water allocation on the state water trading market. Total first-year net benefit: $5,900, leading to a payback period of 4 months, even without cost share.
Regulatory and Water Rights Requirements for Meter Installation
Most water-stressed states have specific installation standards that must be met to comply with water rights rules. For example, Colorado requires all agricultural diversions over 100 gpm to have meters installed by 2025, with straight pipe runs matching manufacturer specifications and accuracy of ±5% or better. Fines for non-compliant installations start at $500 per day. In the Ogallala Aquifer region, 82% of groundwater management districts require third-party verification of meter installation and calibration every 3 years; random audits have found 31% of self-installed meters fail accuracy requirements due to installation errors, leading to temporary 10% water allocation cuts until corrections are made. Farms with properly installed, calibrated meters are also eligible to participate in water trading programs, which generate $500-$1,200 per acre-foot in additional revenue for unused water allocations, per 2023 Colorado Water Conservation Board data.