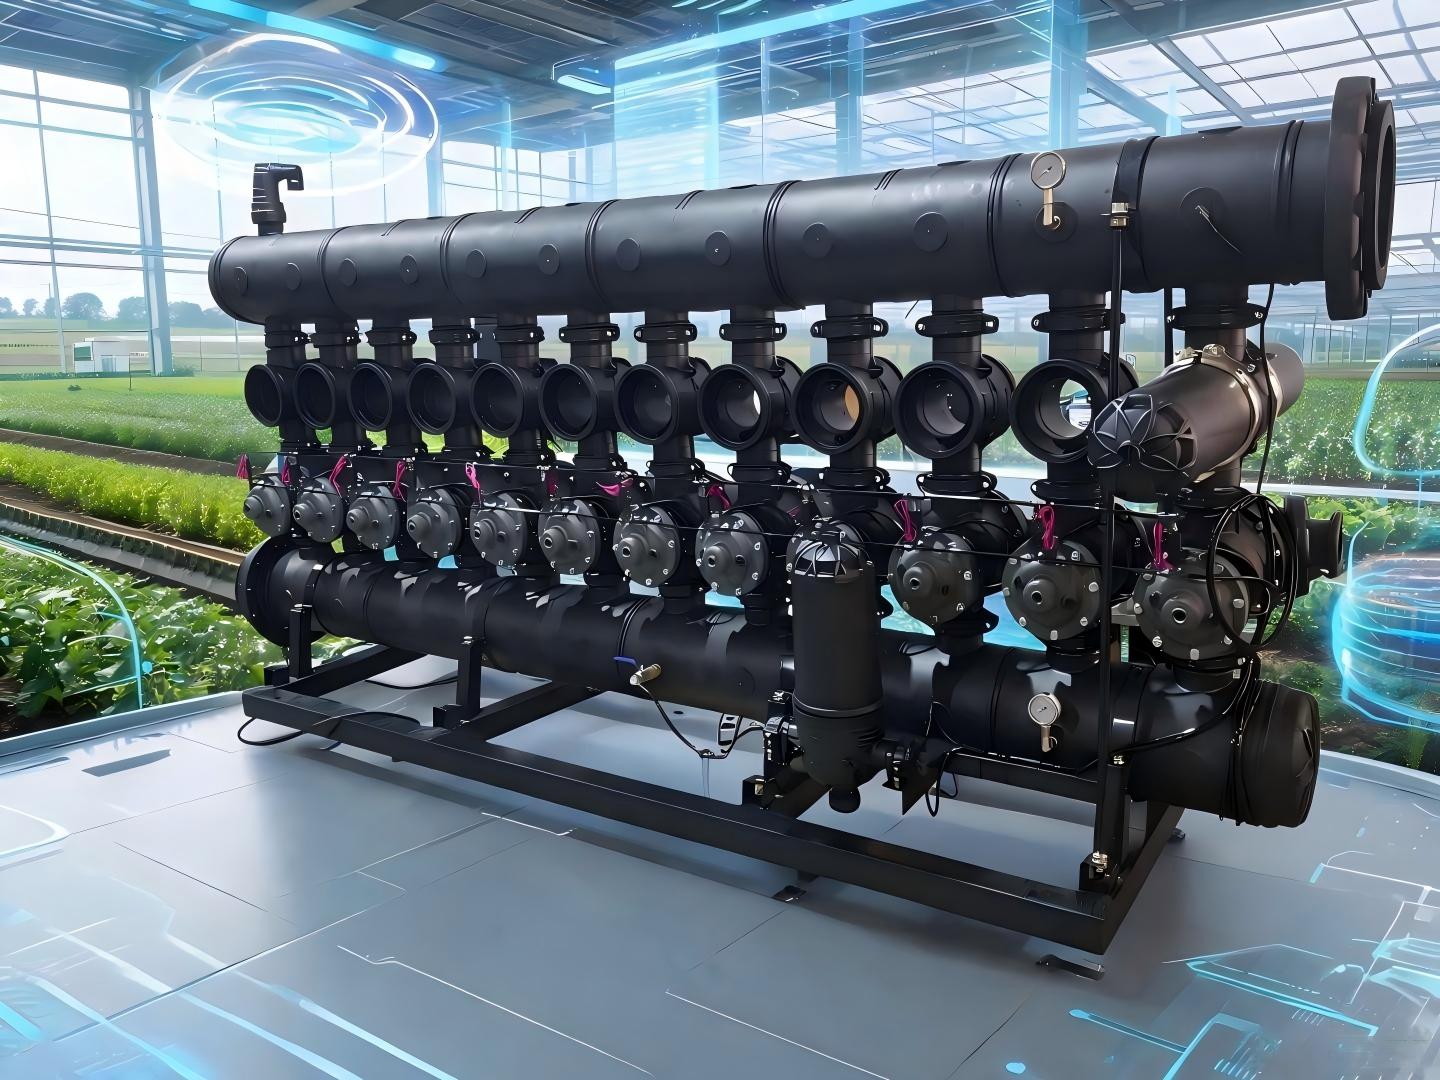
Global agricultural production faces unprecedented pressure: the UN Food and Agriculture Organization (FAO) estimates food output must rise 70% by 2050 to feed a projected 9.7 billion global population, while 40% of agricultural land now faces chronic water scarcity, and World Bank data shows global fertilizer prices rose 23% between 2021 and 2023, squeezing farm profit margins across every commodity category. For growers seeking to cut input costs, boost yields, and reduce environmental impact, fertigation— the precise delivery of soluble nutrients directly to crop root zones via irrigation infrastructure—has emerged as an evidence-backed, scalable solution. A 2024 Irrigation Association report found global fertigation adoption grew 68% between 2018 and 2023, as operations of all sizes recognize the technology’s ability to solve core production challenges, from nutrient leaching to labor shortages. This guide breaks down peer-reviewed benefits of fertigation, compares common system designs, and provides a step-by-step, spec-aligned setup framework to maximize return on investment (ROI) and avoid common operational pitfalls.
What Is a Fertigation System, and How Does It Differ from Traditional Fertilizer Application?
Core Operating Principle
Unlike traditional broadcast or side-dress fertilizer application, which requires separate equipment passes to spread granular or liquid nutrients across the soil surface, fertigation syncs water and nutrient delivery to match real-time crop demand. Nutrients are diluted to a safe, crop-specific concentration, injected into irrigation water at a precise ratio, and delivered uniformly across the field directly to the active root zone, eliminating the inefficiencies of nutrient movement through surface soil, volatilization, and runoff. The first commercial fertigation systems were deployed in Israeli citrus orchards in the 1960s, but advances in low-cost injectors, sensors, and drip tubing have made the technology accessible to operations ranging from 0.5-acre smallholder farms to 10,000-acre row crop operations.
Primary System Classifications
Fertigation systems are categorized by their paired irrigation delivery method, which dictates efficiency, cost, and best-use cases. Per the 2024 Irrigation Association Global Market Report, global fertigation deployments break down as follows: surface drip fertigation (52% of installations), subsurface drip irrigation (SDI) fertigation (26%), center pivot fertigation (17%), and micro-sprinkler/gravity-fed systems (5%). Each design delivers nutrients at different application rates and precision levels, with no one-size-fits-all solution for every crop or farm.
Evidence-Based Fertigation System Benefits for Commercial and Small-Scale Operations
All fertigation benefits are backed by decades of peer-reviewed land-grant university, USDA, and FAO research, with measurable, quantified impacts on yield, input costs, and long-term soil health. Unlike anecdotal claims about new farm technologies, the data on fertigation ROI is consistent across geographies, crop types, and operation scales.
1. Higher Nutrient Use Efficiency (NUE) and Reduced Fertilizer Costs
Traditional broadcast fertilizer application is notoriously inefficient: USDA Agricultural Research Service (ARS) 2023 data shows average NUE for broadcast nitrogen (N) across U.S. row crops is just 42%, meaning 58% of applied N is lost to volatilization, leaching, or runoff before crops can access it. For high-value fruit and vegetable crops, broadcast NUE drops even lower, to 35-40% in sandy soils with high rainfall. Fertigation eliminates nearly all of these losses by delivering nutrients directly to the root zone in soluble form, eliminating surface contact and reducing excess nutrient movement below the root zone.
- USDA ARS trials across 12 corn-producing states found drip fertigation boosts average NUE to 81%, cutting required N applications by 39% while maintaining or increasing yields, equal to $112 per acre in fertilizer savings at 2024 average N prices of $1.16 per pound.
- University of California Davis 2022 processing tomato trials found broadcast applications required 225 lbs of N per acre to hit maximum yield targets, while fertigation required just 125 lbs of N per acre to deliver identical 48 ton per acre yields, a 44% reduction in N inputs worth $116 per acre.
- University of Nebraska-Lincoln research shows granular urea applied via broadcast loses 20-40% of its N content to atmospheric volatilization within 7 days of application, even when incorporated via tillage; fertigation reduces N volatilization losses to less than 3%, because nutrients are dissolved in water and delivered below the soil surface with no exposed granular material.
2. Increased Crop Yields and Improved Crop Quality Consistency
A 2022 meta-analysis published in Agricultural Water Management reviewed 1,200 global field trials of fertigation across 32 crop types, finding the technology increased average yields by 36% compared to conventional irrigation + broadcast fertilization, with even larger gains for high-value permanent and vegetable crops. These yield gains come from two core mechanisms: uniform nutrient delivery across every plant in the field, and the ability to “spoon-feed” nutrients at exactly the growth stage when crops need them most, rather than relying on 1-2 large fertilizer applications per season.
- University of Florida IFAS 2023 citrus trials found SDI fertigation delivered 42% higher yields over 7 years compared to micro-sprinkler irrigation with broadcast fertilizer, plus an 18% higher packout rate for fresh market fruit due to consistent nutrient delivery that reduced fruit size variability.
- 2023 University of Idaho potato trials found drip fertigation increased U.S. No. 1 potato yields by 27% compared to center pivot irrigation with side-dress fertilizer, as consistent phosphorus delivery during tuber set reduced common scab incidence by 31% and increased average tuber size by 14%.
- Cornell University 2022 fresh market tomato trials found fertigation reduced fruit blossom end rot incidence by 62% compared to broadcast fertilization, due to consistent calcium delivery directly to root zones during fruit set, eliminating the calcium uptake disruptions caused by uneven soil moisture.
3. Reduced Water Use and Improved Irrigation Efficiency
Fertigation eliminates the need to over-irrigate to move broadcast fertilizer into the root zone, a practice that wastes 25-35% of applied irrigation water in furrow and sprinkler systems, per FAO data. When paired with high-efficiency delivery methods like drip or SDI, fertigation cuts total agricultural water use by 40-60% compared to furrow irrigation with broadcast fertilization, making it a critical tool for drought-prone regions.
- Texas A&M AgriLife 2018-2022 cotton trials in the Texas High Plains found growers using SDI fertigation reduced total water application by 52% while increasing lint yields by 29%, boosting water productivity from 2.1 lbs of lint per acre-inch to 4.6 lbs of lint per acre-inch.
- Arizona Department of Water Resources data shows lettuce growers using drip fertigation in the Yuma Valley reduced water use by 58% compared to furrow irrigation, while meeting mandatory Colorado River water cutback requirements without yield losses.
4. Lower Labor, Equipment, and Soil Health Costs
Traditional fertilizer application requires multiple equipment passes per season: spreading, tilling to incorporate nutrients, and post-application cultivation, all of which add labor costs, fuel costs, and cause long-term soil damage. Fertigation eliminates nearly all of these passes, as nutrient delivery is fully integrated into regular irrigation events.
- 2024 University of Georgia cost analysis for 100-acre vegetable farms found broadcast fertilization requires 7.2 labor hours per acre per growing season for application, incorporation, and cleanup, while fertigation requires just 0.8 labor hours per acre per season—an 89% reduction equal to $19,200 in annual labor savings at the 2024 average farm wage of $27 per hour.
- USDA NRCS data shows the tillage passes required to incorporate broadcast fertilizer cause 2.3 tons per acre of topsoil erosion annually; fertigation eliminates these passes, allowing no-till practices that increase soil organic carbon by 0.12% per year over 5 years, per University of Nebraska trials, increasing topsoil water holding capacity by 18% in the top 12 inches.
- Ohio State University research found fertigation systems reduce subsoil compaction by 34% in corn systems, due to 75% fewer heavy equipment passes across fields, leading to 12% deeper root penetration and greater drought resilience.
5. Precision Nutrient Timing Aligned to Crop Growth Stages
Crops have highly variable nutrient demands across growth stages: for example, corn requires 60% of its total N uptake between the V6 and VT (tasseling) growth stages, a 3-week window that is often missed with side-dress applications delayed by wet field conditions, labor shortages, or equipment breakdowns. Fertigation allows growers to adjust nutrient rates weekly—or even daily—to match crop uptake, eliminating both under-fertilization during critical growth windows and over-fertilization during slow growth periods.
- University of Illinois 2023 corn trials found spoon-feeding N via fertigation during the V6-VT window reduced stalk lodging by 22% and increased test weight by 3.2 lbs per bushel, compared to a single pre-tassel side-dress application.
- North Carolina State University sweet potato trials on sandy soils found weekly split fertigation applications reduced N leaching by 71% compared to two split broadcast applications, as broadcast N was shown to leach below the root zone with as little as 2 inches of post-application rainfall.
6. Reduced Weed, Pest, and Disease Pressure
Traditional broadcast fertilization spreads nutrients across the entire field surface, including inter-row areas where weed seeds germinate, giving weeds a competitive advantage over crops. Foliar wetness from sprinkler irrigation combined with excess surface nitrogen also creates ideal conditions for fungal pathogens. Fertigation solves both issues by delivering nutrients directly to crop root zones without fertilizing inter-row weeds or wetting foliage.
- University of Arizona 2022 lettuce trials found drip fertigation reduced inter-row weed biomass by 64% compared to furrow irrigation with broadcast fertilizer, cutting required herbicide applications by 48%.
- Cornell University tomato trials found drip fertigation reduced early blight and septoria leaf spot incidence by 29% compared to overhead sprinkler irrigation with broadcast fertilizer, as dry foliage reduced spore spread, and targeted N delivery eliminated excess leaf N that fuels pathogen growth.
- U.S. Crop Insurance Services data shows granular fertilizer burn damages 3-8% of fertilized acres annually, causing $1.2 billion in annual crop insurance claims; fertigation eliminates granular burn risk by delivering nutrients diluted to safe concentrations directly to root zones.
Practical Small-Scale Fertigation Success Example
A 5-acre mixed vegetable farm in western North Carolina growing tomatoes, bell peppers, and summer squash previously relied on furrow irrigation and broadcast 19-19-19 fertilizer with urea side-dress, with 2021 baseline results of: $3,200 in annual fertilizer costs, $1,800 in irrigation/fertilizer labor costs, $1,100 in herbicide costs, 1.2 acre-feet of total irrigation water use, 12,000 lbs per acre tomato yields, and 8,200 lbs per acre bell pepper yields. In spring 2022, the farm installed a low-cost gravity-fed drip fertigation system for a total cost of $4,800 ($960 per acre). First-season results included: 41% lower fertilizer costs ($1,888 total), 78% lower labor costs ($396 total), 45% lower herbicide costs ($605 total), 53% lower water use (0.56 acre-feet), 38% higher tomato yields (16,560 lbs per acre), and 32% higher pepper yields (10,824 lbs per acre). The system reached full payback in 7.2 months from reduced input costs and higher crop revenue.
Fertigation System Comparison: Matching Design to Your Operation
Selecting the right fertigation system requires balancing upfront cost, crop type, field slope, water source, and long-term management goals. The table below compares the five most common system designs using 2024 installed cost data and peer-reviewed performance metrics:
| System Type | 2024 Upfront Cost Per Acre (USD) | Ideal Use Case | Nutrient Use Efficiency Rating | Water Savings vs. Conventional Furrow Irrigation | Maintenance Requirements | Typical Crop Applications |
|---|---|---|---|---|---|---|
| Surface Drip Tape Fertigation | $800–$1,500 | Small to mid-size vegetable/row crop operations, flat to gently sloped land, 3–7 year crop rotations | 78–85% | 45–55% | Low: biweekly line flushes, tape replacement every 3–7 years | Tomatoes, peppers, leafy greens, cotton, strawberries |
| Subsurface Drip Irrigation (SDI) Fertigation | $1,800–$3,200 | Large-scale row crop or permanent crop operations, long-term (10+ year) installations, drought-prone regions | 82–92% | 50–65% | Very low: annual line flushes, 15–25 year tubing lifespan | Corn, soybeans, alfalfa, citrus, vineyards |
| Center Pivot Fertigation | $1,200–$2,400 | Large, flat field crop operations with existing center pivot infrastructure | 65–75% | 25–40% | Medium: annual nozzle checks, seasonal injector calibration | Corn, wheat, potatoes, sugar beets |
| Micro-Sprinkler Fertigation | $1,100–$2,100 | Permanent orchard/vineyard operations, sloped land, sites requiring frost protection | 70–78% | 35–50% | Medium: monthly sprinkler head checks for clogging | Almonds, apples, avocados, wine grapes |
| Gravity-Fed Drip Fertigation | $300–$700 | Smallholder operations, off-grid farms, low-pressure water sources (rain tanks, gravity-fed streams) | 72–80% | 40–50% | Low: weekly filter cleaning, annual line flushes | Small-scale vegetables, subsistence crops, high-value herbs |
Cost-Share and Payback Context
Upfront costs can be reduced significantly via public incentive programs: the USDA NRCS Environmental Quality Incentives Program (EQIP) covers 50–75% of fertigation installation costs for eligible U.S. operations, with higher coverage rates for historically underserved producers and farms in high-priority watersheds. Across all system types, 2024 Irrigation Association data shows average payback periods of 1.1 years for high-value vegetable crops, 2.8 years for permanent orchard crops, and 2.7 years for row crops when EQIP cost share is applied. Retrofitting an existing drip, pivot, or micro-sprinkler system for fertigation costs just $250–$450 per acre, with an average payback period of 1.2 years, as growers only need to add injectors, filtration, and backflow prevention rather than installing full irrigation lines.
Step-by-Step Fertigation System Setup for Reliable, Clog-Free Operation
Proper design and installation are critical to avoid clogging, nutrient uniformity issues, and regulatory non-compliance, which can erode ROI and cause crop damage. The framework below follows Irrigation Association and land-grant university best practices, with actionable, spec-specific guidance for long-term reliability.
Step 1: Pre-Installation Site Assessment and Planning
Rushing to purchase components before completing a full site assessment is the leading cause of underperforming fertigation systems. Complete these four tasks before ordering equipment:
- Full water source testing: Submit water samples to a certified lab to test pH, electrical conductivity (EC), total dissolved solids (TDS), iron, manganese, calcium, and biological content (algae, iron bacteria). Water with >0.3 ppm iron, >0.1 ppm manganese, or >500 ppm TDS requires specialized filtration to prevent emitter clogging; University of California research shows water with 1.2 ppm iron will cause 60% emitter clogging within 3 growing seasons without a sand media filter and periodic chlorine injection.
- Crop nutrient demand mapping: Collect soil samples at 0–6 inch, 6–12 inch, and 12–24 inch depths to establish baseline nutrient levels, then build a weekly nutrient application schedule aligned to each crop’s growth stage uptake rates. For example, processing tomatoes require 2 lbs N per acre per week during early vegetative growth, ramping to 5 lbs N per acre per week during fruit set, then tapering to 1 lb N per acre per week during ripening. This schedule forms the basis for your injection programming.
- Existing infrastructure audit: Measure your irrigation system’s total flow rate (gallons per minute, GPM), operating pressure (pounds per square inch, PSI), and zone size to ensure injector capacity matches demand. For example, a 10-acre drip zone with 0.5 GPM emitters spaced 12 inches apart requires a total flow rate of 5,445 gallons per hour, so injectors must be sized to deliver nutrient solution into that flow without causing pressure drops of more than 10%.
- Regulatory compliance check: The EPA reports 42 U.S. states require approved backflow preventers on all fertigation systems to stop nutrient solution from back-siphoning into public or domestic water supplies, with fines for non-compliance reaching $10,000 per day in high-priority watersheds. Confirm local code requirements with your state department of agriculture before installation.
Step 2: Select Core Components With Performance Specs
Every fertigation system requires five core component categories, with sizing matched to your site assessment data:
- Backflow prevention assembly: For systems connected to municipal or shared water sources, install a reduced pressure zone (RPZ) valve sized to 150% of your maximum system flow rate; for private well sources, a double check valve assembly meets code requirements in most jurisdictions. Never operate a fertigation system without approved backflow protection.
- Primary filtration system: Emitter clogging causes 80% of fertigation system failures in the first 5 years, so filter selection is non-negotiable. Match filter type to water quality:
- Clean well water with <0.2 ppm iron: 120-mesh screen filter sized for 120% of system flow rate
- Surface water (pond, canal, river) or water with >0.2 ppm iron/manganese: 20-inch sand media filter with 140-mesh screen backup, set to automatically backflush when pressure differential reaches 5 PSI
- Systems using organic soluble fertilizers (fish emulsion, liquid humates): Add a 150-mesh disc filter after the injection point to catch undissolved organic particles
- Fertilizer injector system: Select an injector based on accuracy needs, flow rate, and budget:
- Venturi injectors: Low cost ($150–$400 per unit), no moving parts, 3–5% injection accuracy, operate with a 15–25% pressure differential across the unit, ideal for operations <5 acres
- Positive displacement (diaphragm) injectors: Mid cost ($800–$2,500 per unit), 1–2% injection accuracy, consistent ratio across pressure fluctuations, ideal for 5–100 acre operations
- Computerized proportional injection pumps: High cost ($3,000–$12,000 per unit), <0.5% accuracy, programmable to adjust rates in real time, integrated with soil sensors, ideal for >100 acre operations or high-value crops (berries, citrus, controlled-environment agriculture)
- Fertilizer storage and mixing system: Use food-grade polyethylene tanks sized to hold 2–3 weeks of nutrient supply at maximum application rate, with a mechanical mixer or recirculation pump to prevent nutrient settling (especially for calcium and phosphorus fertilizers that precipitate out of solution at high concentrations). For example, a 10-acre tomato operation applying 5 lbs N per acre per week requires a minimum 150-gallon stock tank when using a 1:100 injection ratio.
- Monitoring sensors: Minimum required sensors include pressure gauges before and after filters, an EC sensor and pH sensor at the farthest emitter in each zone to confirm uniform nutrient delivery, and a flow meter to track total water and nutrient application. For advanced systems, add soil moisture sensors at 6, 12, and 24 inch depths and soil EC sensors to adjust rates based on real-time root zone conditions; USDA ARS data shows these sensors add an extra 15% to NUE by eliminating over-application.
Step 3: Physical Installation Best Practices
Follow this installation sequence to avoid leaks, clogs, and pressure imbalances:
- Install the backflow preventer at the water source connection, followed by the main shutoff valve and primary filtration system. Pressure test all connections at 125% of operating pressure before adding injection equipment to catch leaks early.
- Install injectors 12–18 inches downstream of the primary filter, with check valves on all suction and discharge lines. Elevate stock tanks 12–18 inches above the injector on a level concrete or compacted gravel pad to provide positive suction head, reducing pump wear.
- Install EC/pH sensors at three points: immediately after the injector, at the midpoint of each irrigation zone, and at the farthest emitter from the valve. A variance of more than 10% in EC between the injector and farthest emitter indicates a pressure imbalance or partial clog that requires correction.
- Flush all main lines, sub-mains, and lateral lines for 10–15 minutes before installing emitters to remove plastic shavings, dirt, and installation debris that can cause clogging. After emitter installation, run the system for 5 minutes to confirm uniform flow across all emitters.
Practical Commercial Installation Example: A 20-acre central Illinois corn operation installed an SDI fertigation system in spring 2023, with components including a 2-inch RPZ backflow preventer ($420), 30 GPM automatic backflush sand media filter ($2,800), dual diaphragm injectors for N/P/K and micronutrients ($3,600 total), two 300-gallon agitated stock tanks ($1,100 total), multi-point EC/pH monitoring ($1,800), and 15 mil SDI tubing buried 14 inches deep with 2 GPH emitters spaced 24 inches apart ($42,000 total). Total installed cost was $51,720 ($2,586 per acre). With EQIP cost share covering 70% of costs, the grower’s net investment was $15,516. First-season results included 228 bushel per acre corn yields (up from 183 bushels with conventional side-dress), 42% lower N application, 48% less irrigation water use, and a $218 per acre increase in net return, for a 3.5 year payback on net investment.
Step 4: System Calibration for Precise Nutrient Delivery
Calibration is not a one-time task: complete it at the start of every growing season, after any injector repair, and when switching fertilizer types. Follow this standardized process:
- Calculate your target injection ratio: The ratio refers to the volume of stock fertilizer solution mixed with irrigation water (e.g., a 1:100 ratio means 1 gallon of stock solution is injected per 100 gallons of irrigation water). Select a ratio that keeps applied nutrient EC within crop tolerance levels (1.0–1.8 dS/m for corn, 1.5–2.5 dS/m for most vegetables, per FAO guidelines) to avoid root burn.
- Measure actual injector output: Place the injector suction line into a marked 5-gallon bucket of clean water, run the system at normal operating pressure for 10 minutes, and measure the volume of water pulled from the bucket. For example, a 1:100 ratio on a 50 GPM system should pull 5 gallons of solution in 10 minutes (0.5 GPM injection rate). Adjust the injector dial until measured output is within 2% of the target rate.
- Test nutrient uniformity across the zone: Collect water samples from 10 emitters spread across the zone (near the valve, mid-zone, farthest point, high and low elevation points) during an injection cycle, and test each for EC and nitrate concentration. Uniformity is acceptable if all samples are within 10% of the target EC; larger variances indicate pressure imbalances that require pressure regulator installation or line repairs.
- Establish post-injection flush protocols: After every fertigation event, run clean water through lines for 15–20 minutes to flush residual fertilizer out of laterals, preventing algae growth and mineral precipitation that causes clogs.
Step 5: Ongoing Maintenance to Extend System Lifespan
A 2024 Irrigation Association survey found 68% of fertigation system failures in the first 3 years are caused by inadequate maintenance, cutting system lifespan by 40% on average. Follow this scheduled maintenance plan:
- Weekly tasks: Check filter pressure gauges, clean screen filters if pressure differential exceeds 5 PSI, inspect stock tanks for algae or settled solids, and confirm EC readings at the farthest emitter match target levels.
- Monthly tasks: Inspect 5% of emitters per zone for clogging, clean injectors per manufacturer guidelines, and test stock solution pH to prevent precipitation (calcium and phosphate fertilizers form insoluble calcium phosphate solids if stock tank pH rises above 7.0; add phosphoric or nitric acid to maintain stock pH of 6.0–6.5 when using calcium sources).
- Seasonal (pre-plant and post-harvest) tasks: Flush all lines with a 10 ppm chlorine solution to control algae and bacteria, or a mild acid solution to dissolve mineral scale; test backflow preventers for proper operation; calibrate injectors; repair damaged lines or emitters; and drain all lines in freezing climates to prevent freeze damage. University of California research shows post-harvest line flushing reduces long-term emitter clogging rates by 72%.
Common Fertigation Mistakes That Erode ROI (And How to Avoid Them)
Even well-designed systems can underperform if growers make avoidable operational errors. The most common costly mistakes, based on land-grant university diagnostic data, include:
1. Mixing Incompatible Fertilizers in the Same Stock Tank
Some fertilizer combinations react to form insoluble precipitates that clog emitters within hours: for example, mixing calcium nitrate with ammonium phosphate forms solid calcium phosphate, which cannot be flushed from lines without extensive acid treatment. University of Nebraska-Lincoln data shows 41% of early emitter clogging events are caused by incompatible fertilizer mixing. Avoid this issue by using separate stock tanks for incompatible nutrients, or conducting a jar test before mixing: combine fertilizers at the planned concentration in a clear jar, let sit for 2 hours, and do not use the mix if sediment forms.
2. Over-Fertigating Due to Lack of Real-Time Monitoring
Many growers set injection rates based on traditional broadcast fertilizer rates, leading to over-application, root zone salt buildup, and reduced yields. A 2023 Washington State University study of apple orchards found 38% of fertigation users were applying 25–40% more N than crop requirements, leading to excessive vegetative growth, 21% higher fire blight susceptibility, and 12% lower fruit yields. Correct this by conducting weekly leaf tissue tests during the growing season, and using soil EC sensors to adjust rates to match real-time crop demand, rather than relying on static application schedules.
3. Skipping Filtration for “Clean” Water Sources
Even visually clear well water can contain iron bacteria, fine sand, or dissolved minerals that build up in emitters over time. The Irrigation Association found growers who skipped recommended filtration on well water systems experienced 3x higher emitter clogging rates and 40% shorter system lifespans, compared to growers with properly sized filters. There is no scenario where fertigation can operate reliably without appropriate upstream filtration.
4. Ignoring Water pH Impacts on Nutrient Availability
If irrigation water pH is above 7.5, phosphorus and key micronutrients (iron, zinc, manganese) become chemically unavailable to crops, even when injected at correct rates. A University of Florida citrus study found irrigation water with a pH of 8.0 reduced phosphorus availability by 62% in fertigation systems, leading to visible nutrient deficiency symptoms despite adequate P application. Correct this by injecting small amounts of phosphoric or nitric acid to maintain irrigation water pH of 5.8–6.5, which maximizes nutrient availability for all major crop types.
Long-Term Fertigation ROI Across Operation Types
Fertigation delivers consistent positive returns across every farm scale and crop category, per peer-reviewed cost-benefit analyses:
- High-value vegetables (tomatoes, peppers, berries): 2024 Penn State cost analysis for 50-acre fresh market tomato farms found average surface drip fertigation costs of $1,200 per acre, with average annual net gains of $1,890 per acre from higher yields, lower inputs, and reduced labor, for an 8-month payback and 158% first-year ROI.
- Permanent crops (citrus, almonds, vineyards): 2023 University of California analysis for 100-acre almond orchards found SDI fertigation costs of $2,700 per acre, with average annual net gains of $820 per acre from 31% higher yields, 38% lower water use, and 42% less fertilizer, for a 3.3 year payback and 30% annual ROI over the 20-year system lifespan.
- Row crops (corn, soybeans, cotton): 2023 USDA ARS data for 200-acre corn/soybean rotations found SDI fertigation costs of $2,200 per acre, with average annual net gains of $245 per acre from 24% higher yields, 39% less fertilizer, and 51% lower water use, for a 9-year payback period that drops to 2.7 years when EQIP cost share and reduced drought-related crop insurance losses are included.
- Smallholder farms (<10 acres): 2022 FAO data from 1,400 smallholder farms in Kenya, Tanzania, and Malawi using low-cost gravity-fed fertigation found average upfront costs of $420 per acre, with average annual net gains of $680 per acre from higher vegetable yields, for a 7.4 month payback and 3.2x increase in household income within 2 years of installation.
Conclusion: Is Fertigation Right for Your Operation?
As input costs, water scarcity, and production pressure continue to rise, fertigation is no longer a niche technology for high-value crop operations—it is a scalable, evidence-backed tool