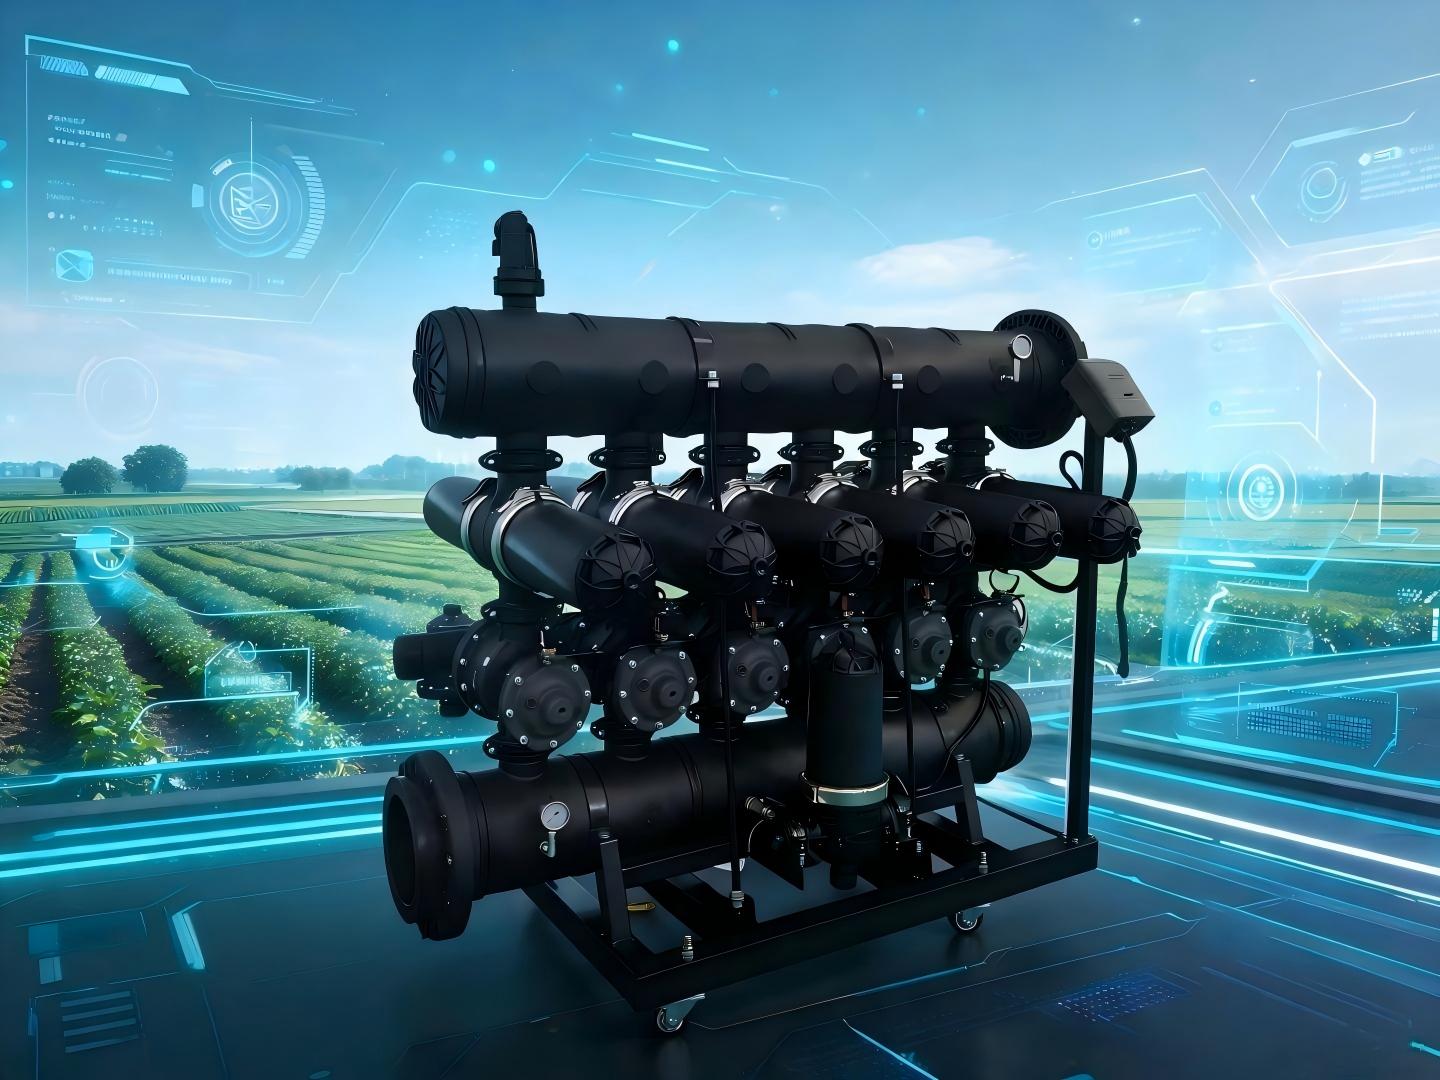
Commercial irrigation system design is the foundational engineering process that aligns water delivery hardware, hydraulic infrastructure, and operational controls to meet the specific agronomic, financial, and regulatory requirements of large-scale agricultural, nursery, and specialty crop operations. Unlike residential irrigation or temporary farm watering setups, commercial systems are engineered to operate reliably across hundreds or thousands of acres for 15+ years, with precise application rates that balance crop yield goals, water conservation, energy efficiency, and long-term maintenance costs. Data from the 2024 Irrigation Association (IA) industry report shows that 61% of commercial agricultural operations rely on professionally designed irrigation systems as of 2024, up from 42% in 2018, as water costs rise, drought conditions persist, and regulatory efficiency mandates become more widespread. Poorly designed commercial irrigation systems cost U.S. agricultural operations an estimated $1.2 billion annually in lost crop revenue, wasted water, excess energy costs, and premature equipment failure, per USDA Natural Resources Conservation Service (NRCS) calculations. This guide breaks down the core principles of high-performing commercial irrigation system design, with quantified performance data, cross-system comparisons, real-world case studies, and actionable frameworks to maximize return on investment (ROI) and long-term resilience.
Core Business and Agronomic Impacts of Optimized Commercial Irrigation System Design
Professional commercial irrigation design delivers measurable financial and operational returns that far outweigh upfront engineering costs, particularly as input costs and regulatory pressure rise across agricultural regions. Unlike ad-hoc installations that use generic hardware layouts, engineered systems are tailored to unique site conditions, eliminating waste and reducing operational risk over the full equipment lifecycle.
Quantified ROI of Professional Design vs. Ad-Hoc Installation
The financial gap between a professionally engineered commercial irrigation system and an ad-hoc, non-engineered installation is substantial, with measurable impacts on yield, input costs, and long-term equipment value. A 2023 USDA NRCS multi-state study of 1,200 commercial farm operations found that systems built to formal, site-specific engineering designs delivered an average of:
- 30-50% lower annual irrigation water use compared to outdated or non-designed systems, reducing water cost exposure by an average of $52 per acre annually in regions with metered water rights
- 15-25% higher average crop yields due to consistent soil moisture levels across all field zones, eliminating yield drag from under-watered edges or over-watered low-lying areas
- 18-22% lower annual energy costs for pumping, as correctly sized pipe and pump infrastructure reduces friction loss and avoids inefficient pump operation
- 35% lower annual maintenance costs, as design specifications match hardware pressure ratings and include access points for routine upkeep
For context, Iowa State University Extension documented a 500-acre corn operation in Boone County, Iowa, that installed a used center pivot system without formal design calculations in 2020. The ad-hoc setup had 38% higher water application variability across the field, with distribution uniformity (DU) of just 59% compared to the 85% minimum standard recommended by the American Society of Agricultural and Biological Engineers (ASABE). Over two growing seasons, the operation saw a 12-bushel-per-acre yield drag on corn, totaling $14,280 in lost annual revenue at 2022 corn prices of $5.95 per bushel, plus $7,100 in excess water and energy costs from overwatering high-pressure zones near the pump. A professional design retrofit in 2022, which included nozzle resizing, pressure regulator installation, and variable frequency drive (VFD) pump controls, raised DU to 89%, eliminated yield drag, and delivered full payback on the $38,000 retrofit cost in 2.1 years.
Regulatory and Risk Mitigation Benefits
Beyond direct financial returns, formal commercial irrigation system design is increasingly a requirement to comply with state and federal water regulations, reducing exposure to non-compliance fees and water right curtailments during drought. For example, California’s Sustainable Groundwater Management Act (SGMA) requires all commercial agricultural operations over 50 acres in critically overdrafted groundwater basins to submit irrigation efficiency plans proving minimum 75% application efficiency starting in 2025; operations with systems designed to meet or exceed this standard avoid fines of up to $1,200 per acre for non-compliance. A 2024 IA survey of commercial producers found that operations with professionally designed systems were 47% less likely to face water allocation curtailments during drought, as documented efficiency metrics prioritize their access to remaining water supplies over operations with unmeasured, high-waste systems. Proper design also reduces liability from agricultural runoff: systems engineered to eliminate overwatering and runoff reduce the risk of Clean Water Act fines for sediment, fertilizer, or pesticide transport into adjacent waterways, which can range from $10,000 to $25,000 per violation for commercial operations.
Non-Negotiable Pre-Design Assessment Criteria for Commercial Irrigation Systems
Every high-performing commercial irrigation system starts with a data-driven pre-design audit, as on-site variables directly impact hardware selection, hydraulic calculations, and long-term performance. Skipping these assessments is the leading cause of underperforming systems, per 2023 ASABE research, which found that 72% of system failures leading to more than 10% crop loss stemmed from incomplete pre-design data collection.
Site-Specific Agronomic Baseline Mapping
The first step in pre-design is collecting granular, field-level data on soil, topography, and crop water requirements to match application rates to site conditions. Key data points collected during this phase include:
- Soil texture and infiltration rates: Infiltration rates vary from 0.1-0.2 inches per hour for heavy clay soils to 0.5-1.0 inches per hour for sandy loam, directly determining maximum application rates to avoid surface runoff and deep percolation. For example, a system designed to apply 0.3 inches per hour on clay soil will cause 40%+ runoff, wasting water and carrying topsoil and nutrients off-field.
- Crop evapotranspiration (ETc) rates by growth stage: Peak water demand varies widely by crop: UC Davis 2023 crop water use data shows alfalfa has a peak ETc of 0.32 inches per day during mid-summer growth, processing tomatoes reach 0.28 inches per day during fruit set, and mature apple orchards require 0.22 inches per day. Design must match system flow capacity to meet peak ETc demand across all zones during the hottest, driest growing periods.
- High-resolution topographic slope mapping: Slopes greater than 3% cause water flow toward low-lying areas unless pressure-compensating hardware is used, while slopes over 8% require reduced nozzle flow rates and closer emitter spacing to prevent runoff. LiDAR topographic mapping accurate to 6-inch elevation changes is now standard for commercial designs to eliminate slope-related application errors.
- Root zone depth: Shallow-rooted crops like blueberries (12-18 inch root zone) require frequent, low-volume applications, while deep-rooted crops like alfalfa (3-6 foot root zone) can tolerate less frequent, higher-volume applications, directly impacting emitter flow rate and scheduling parameters.
Water Source and Hydraulic Capacity Audits
The second core pre-design step is a full audit of available water sources, including flow capacity, water quality, and legal allocation limits. A common costly mistake is designing a system around assumed water capacity, rather than measured values. For example, a 200-acre commercial vineyard in Sonoma County, California, designed its drip irrigation system around a reported well yield of 400 gallons per minute (GPM) in 2021, but skipped formal flow testing. Post-installation, actual well yield during peak summer demand was only 250 GPM, meaning the system could only deliver 62% of required water to the farthest vine rows, leading to 27% vine stress in the first year and $89,000 in replanting and pump retrofit costs. Key audit metrics include:
- Measured minimum well yield or surface water diversion capacity during peak demand periods, accounting for multi-year drought-related yield declines
- Water quality testing for sediment load, pH, iron, manganese, and bacterial content, which determines required filtration levels to prevent emitter clogging (surface water with high sediment requires sand media filters, while clean well water may only require screen filters)
- Legal water allocation limits, to ensure total system flow does not exceed permitted diversion volumes, even during peak growth
- Existing pump station pressure and flow capacity, to determine if upgrades are required to meet design pressure requirements across all zones
Operational Goal Alignment
Finally, pre-design assessment must align the system with the operation’s long-term business goals to avoid costly retrofits within the first 5-10 years. Key operational questions to address during this phase include: Does the operation plan to rotate between high-value vegetable crops and field crops, requiring flexible application rates? Is the operation planning to expand acreage in the next 10 years, requiring mainline pipe sized to support additional flow? Does the operation plan to integrate fertigation/chemigation, requiring injection ports and backflow prevention hardware? How much labor is available for irrigation management, impacting the appropriate level of automation? Answering these questions during pre-design reduces future retrofit costs by an average of 60%, per IA data.
Comparative Analysis of Commercial Irrigation System Design Types
There is no one-size-fits-all commercial irrigation system design, as each system type offers tradeoffs between upfront cost, application efficiency, crop suitability, and long-term maintenance requirements. The table below compares core design specifications for the most common commercial irrigation system types, using standardized performance data from ASABE, NRCS, and 2024 IA cost surveys:
| System Type | Design Application Efficiency | Ideal Crop Types | Maximum Compatible Slope | Upfront Design + Install Cost Per Acre | Annual Maintenance Cost Per Acre | Expected Service Life | Average Yield Lift Over Conventional Furrow |
|---|---|---|---|---|---|---|---|
| Subsurface Drip Irrigation (SDI) | 90-95% | High-value row crops, vineyards, orchards, vegetables, berries | 15% (with pressure-compensating emitters) | $1,800-$3,200 | $75-$125 | 15-25 years | 20-30% |
| Center Pivot (LEPA nozzles, VRI-capable) | 80-90% | Field corn, soybeans, wheat, alfalfa, pasture | 15% (with tower grading, corner arms for irregular fields) | $800-$1,800 | $40-$80 | 20-30 years | 12-22% |
| Linear Move | 85-92% | Rectangular-field vegetables, small grains, forages | 8% | $1,200-$2,200 | $55-$95 | 15-20 years | 15-25% |
| Permanent Solid-Set Sprinkler | 70-80% | Orchards, nurseries, container stock, frost protection | 10% | $1,000-$1,900 | $60-$100 | 25-40 years | 8-18% |
| Engineered Furrow (surge valves, tailwater recovery) | 60-75% | Row crops, forages, level-basin rice | 3% | $300-$700 | $30-$60 | 10-15 years | 5-12% |
Matching System Design to Crop Value and Field Scale
Selecting the right system design requires balancing upfront cost against crop revenue per acre to achieve an acceptable payback period. For example, a 2023 University of Illinois extension analysis found that a 1,200-acre corn and soybean operation in central Illinois, generating $800-$1,100 per acre in annual crop revenue, would see the highest ROI from a multi-tower center pivot design with low-energy precision application (LEPA) nozzles and variable rate irrigation (VRI) controls, with a payback period of 3.8 years. On the same acreage, an SDI system would have a 7.2-year payback, as the higher upfront cost is not justified by the relatively lower per-acre crop value. In contrast, an 80-acre organic blueberry operation in western Oregon, generating $18,000 per acre in annual revenue, would achieve 28% higher net returns over 10 years with an SDI design: the system’s high efficiency and precise low-volume application reduce root rot risk, increase berry size, and deliver a 2.9-year payback, compared to a 5.1-year payback for a center pivot system on the same acreage. For operations with mixed crop types, zoned designs that use multiple system types across the property often deliver the highest ROI: for example, a 400-acre operation with 320 acres of field corn and 80 acres of high-value sweet corn may use center pivots for the field corn and SDI for the sweet corn, matching hardware value to crop revenue.
Step-by-Step Commercial Irrigation System Design Framework
Once pre-design assessments are complete and system type is selected, professional irrigation designers follow a standardized, ASABE-aligned design process to ensure consistent performance, hydraulic efficiency, and long-term durability. Rushing or skipping steps in this framework leads to 60% of commercial irrigation performance issues, per 2024 IA field audit data.
Phase 1: Hydraulic Calculation and Pipe Sizing
The technical core of commercial irrigation design is hydraulic calculation, which uses the Hazen-Williams equation to calculate friction loss across all mainline and lateral pipes, ensuring consistent pressure across every emitter or sprinkler head in the system. The core rule of pipe sizing for commercial systems is to maintain water flow velocity below 5 feet per second, which prevents water hammer (pressure surges that crack pipes and damage hardware), reduces friction-related energy loss, and extends pipe service life. Zoning is also completed in this phase: areas with similar elevation, crop water requirement, and soil type are grouped into separate irrigation zones, with matched flow rates to avoid pressure differentials. A common costly example of poor hydraulic design comes from a 300-acre pecan orchard in Georgia, which installed a drip system in 2021 without formal friction loss calculations. The design used 6-inch diameter PVC mainline pipe, which was too small for the 600 GPM system flow, causing a 28 PSI pressure drop between the pump station and the last orchard row. This led to 42% lower water application at the far end of the system, and a 19% lower pecan yield on those rows. A 2022 retrofit that replaced the undersized mainline with 10-inch PVC, sized via formal hydraulic calculations, eliminated the pressure differential, increasing total orchard revenue by $72,000 in the first year post-retrofit.
Phase 2: Application Hardware Selection and Spacing
With hydraulic zones defined, designers select application hardware (emitters, sprinkler nozzles, pressure regulators, filters) matched to site conditions, with spacing calibrated to achieve minimum 85% DU. Key hardware selection criteria include:
- Emitter/nozzle flow rate: Matched to soil infiltration rate to avoid runoff: 0.5 GPH pressure-compensating emitters for sandy loam soils growing leafy greens, 1-2 GPH emitters for deep-rooted orchard crops, and low-flow LEPA nozzles for heavy clay soils with low infiltration rates.
- Sprinkler/emitter spacing: Set to 50% of the effective throw diameter for sprinklers, and spaced to ensure uniform water coverage across 100% of the root zone for drip systems, per ASABE standards. For example, a sprinkler with a 40-foot throw diameter is spaced 20 feet apart along laterals to ensure overlapping coverage and uniform application.
- Pressure regulation: Pressure regulators installed at every zone and at 200-foot intervals along sloped laterals to maintain consistent pressure (typically 15-30 PSI for drip, 40-60 PSI for sprinklers) regardless of elevation changes.
- Filtration: Sized to match water source quality: 200-mesh screen filters for clean well water, 120-mesh sand media filters for surface water with high sediment loads, and automatic flush valves to reduce filter maintenance. Proper filtration reduces emitter clogging rates by 87%, per USDA data, extending system service life by 10+ years.
- Backflow prevention: Required by code in all 50 states for commercial irrigation systems, especially those with chemigation/fertigation capabilities, to prevent chemical or fertilizer backflow into domestic or public water supplies.
Phase 3: Control System Integration and Automation
After hardware is selected, designers integrate control systems matched to the operation’s labor capacity and efficiency goals. Control options range from basic manual zone valves to fully automated cloud-based systems with real-time sensor input. A 2023 American Society of Agronomy study found that commercial irrigation designs integrated with real-time soil moisture sensors and automated controls reduce water use by an additional 23% on top of efficiency gains from properly sized hardware, and cut irrigation labor time by 60%. A practical example comes from a 400-acre processing tomato operation in Fresno County, California, which installed a design with 12 soil moisture sensors per 40-acre zone, connected to a cloud-based control platform that adjusts application rates based on real-time ETc and root zone moisture levels. In 2023, the operation cut water use by 42% compared to its previous furrow system, met SGMA efficiency requirements, and qualified for a $210,000 State Water Efficiency and Enhancement Program (SWEEP) grant that covered 62% of total project costs. For operations with limited broadband access, on-site controllers with satellite ET data deliver 90% of the efficiency gains of cloud-connected systems at a 30% lower upfront cost.
Phase 4: Distribution Uniformity Testing and Design Validation
The final phase of commercial irrigation design is post-installation validation, which uses standardized testing to confirm the system meets design performance targets before full operation. For sprinkler systems, this involves catch can tests: uniform collection cans placed across the field to measure applied water depth and calculate DU, targeting a minimum 85% DU per ASABE standards. For drip systems, validation involves pressure and flow testing at multiple points across every lateral to confirm emitters deliver the designed flow rate within a 5% margin of error. A 2024 NRCS audit of 800 newly installed commercial irrigation systems found that 37% failed initial DU testing due to minor design flaws: incorrect nozzle sizing, missing pressure regulators, or improperly placed check valves, leading to average efficiency losses of 18% before corrections. This validation step is required to qualify for nearly all federal and state irrigation cost-share programs, making it a critical final step in the design process.
Common Commercial Irrigation System Design Mistakes That Erode ROI
Even with access to engineering standards, many commercial designs include preventable flaws that reduce efficiency, increase costs, and shorten equipment life. The most common high-impact mistakes are outlined below, with real-world cost data from IA field audits.
Underinvesting in Pre-Design Soil and Topographic Mapping
Skipping high-resolution topographic and soil mapping to reduce upfront design costs is one of the most expensive long-term mistakes. For example, a 150-acre hops operation in Yakima Valley, Washington, installed a fixed sprinkler system in 2021 using free, low-resolution satellite topographic data that missed a 7% slope across 40 acres of the farm. The design used non-pressure-compensating sprinklers, leading to 3x higher water application at the low end of the slope, causing root rot in 22% of hop bines and $126,000 in lost crop revenue in the first production year. The retrofit to pressure-compensating nozzles and adjusted zone spacing cost an additional $48,000, equal to 22% of the original project budget — 12x the $4,000 cost of a professional LiDAR topographic survey during pre-design.
Incorrectly Sized Pump and Pressure Infrastructure
IA field data shows that 29% of commercial irrigation designs use incorrectly sized pumps, leading to 15-30% higher annual energy costs. Oversized pumps operate outside their peak efficiency curve, generate excess pressure that damages pipes and emitters, and increase nozzle wear rates, while undersized pumps fail to deliver required flow to the farthest field zones. For example, a 500-acre alfalfa operation in southern Idaho installed a 75 HP pump for its center pivot system in 2020, when hydraulic calculations called for a 50 HP pump. The oversized pump maintained a constant 110 PSI operating pressure, 25 PSI above the nozzle design rating, leading to 3x faster nozzle wear, $9,200 in annual excess electricity costs, and $3,100 in annual nozzle replacement costs. Downgrading to the correctly sized pump with a VFD, which adjusts pump speed to match real-time flow demand, cut energy costs by 32% and reduced maintenance costs by 70% in the first year post-correction.
Failing to Design for Long-Term Operational Flexibility
Many designs are optimized for a single crop or current acreage, without accounting for future operational changes, leading to premature system replacement. The most common flexibility oversights include:
- Selecting fixed emitter spacing for a single crop, without accounting for future crop rotation: for example, installing SDI with 48-inch emitter spacing ideal for corn, then rotating to high-density leafy greens that require 18-inch spacing, requiring full lateral replacement at a cost of $1,200+ per acre
- Undersizing mainline pipe capacity to reduce upfront cost, leaving no room for future acreage expansion, requiring full mainline replacement when the operation grows
- Omitting chemigation/fertigation injection ports and backflow prevention in the initial design, leading to uneven nutrient application and 12-18% lower fertilizer use efficiency when fertigation is added later
- Neglecting drain valve design in cold climates, which increases the risk of pipe bursts during freeze events by 30-40%, per University of Minnesota Extension data, leading to $200-$400 per acre in repair costs after cold winters
Compliance, Incentives, and Long-Term Maintenance Planning
A well-designed commercial irrigation system does not just perform well on day one — it is engineered to meet regulatory requirements, qualify for available financial incentives, and minimize long-term maintenance costs over its full service life.
Navigating Regulatory Requirements for Commercial Irrigation Design
Commercial irrigation designs must be aligned with a patchwork of federal, state, and local regulations to avoid penalties. Core regulatory requirements to integrate into design include:
- State water rights and efficiency mandates: As of 2024, 28 U.S. states have minimum irrigation efficiency requirements for new commercial systems, ranging from 70% efficiency in parts of the Great Plains to 85% efficiency in critically overdrafted California groundwater basins. Designs must include flow meters and water use tracking capability to report annual water use to state regulators.
- EPA Clean Water Act discharge rules: Operations with more than 100 acres of irrigated cropland must design systems to eliminate surface runoff that carries sediment, fertilizers, or pesticides into jurisdictional waterways, with many states requiring tailwater recovery systems to capture and reuse runoff.
- NRCS conservation practice standards: Designs aligned with NRCS Standard 441 (Sprinkler Irrigation Systems) or Standard 442 (Drip Irrigation Systems) meet automatic eligibility requirements for federal cost-share programs, and are 47% less likely to face water curtailments during drought, per IA data.
Maximizing Available Cost-Share and Incentive Programs
Designing systems to meet conservation standards unlocks significant financial incentives that can reduce upfront project costs by 35-100%, drastically shortening payback periods. Key programs to design for include:
- USDA EQIP Program: The Environmental Quality Incentives Program provides 35-75% cost share for irrigation designs that meet NRCS conservation standards, with $1.75 billion in 2024 funding earmarked for agricultural water efficiency projects. Historically underserved and organic producers are eligible for up to 90% cost share.
- State-level efficiency programs: Programs like California’s SWEEP, Washington’s Irrigation Efficiencies Grant Program, and Texas’s Water Conservation Initiative provide grants covering 50-100% of project costs for systems that reduce groundwater use and meet state efficiency targets.
- Local utility rebates: Rural electric cooperatives and water districts offer rebates of $150-$300 per HP for high-efficiency VFD pumps, plus rebates for high-efficiency nozzles and soil moisture sensors, reducing upfront costs by an additional 5-10% on average.
A 600-acre wheat and canola operation in eastern Washington designed its new linear move irrigation system to meet NRCS 442 standards, including soil moisture monitoring and VRI controls, in 2022. The operation received $248,000 in EQIP funding and $32,000 in local utility rebates, covering 68% of the total $412,000 project cost, and reducing payback period from 6.7 years to 2.1 years.
Designing for Proactive, Low-Cost Long-Term Maintenance
The best commercial irrigation designs integrate maintenance access into the initial layout, reducing long-term upkeep costs and extending service life. Key maintenance-focused design features include: isolation valves every 20 acres to allow repairs without shutting down the entire system; flush valves at the end of every lateral line to remove sediment buildup without disassembling pipes; pressure test ports at key mainline and lateral points to quickly diagnose pressure drops and leaks; and filter systems positioned at ground level with easy access for cleaning, without requiring specialized equipment. 2023 ASABE research found that systems designed with these maintenance features have 35% lower annual maintenance costs and 40% longer service life than systems designed without maintenance access, delivering an extra $120-$180 per acre in net value over the system’s life.
Real-World Commercial Irrigation System Design Case Studies
The following real-world case studies demonstrate the measurable performance and financial impacts of professional commercial irrigation system design across different operation types and scales.
Case Study 1: 1,800-Acre Corn/Soybean Operation, Central Nebraska
Pre-design (2021) baseline: The operation used traditional furrow irrigation with 58% application efficiency, losing 32% of applied water to runoff and deep percolation. Average corn yields were 182 bushels per acre (BPA), average soybean yields were 54 BPA, with annual irrigation water costs of $112 per acre. Design solution: 7 multi-tower center pivots with LEPA nozzles, VRI controls tied to 36 soil moisture sensors across the property, VFD pump stations, and a tailwater recovery system designed to capture 95% of surface runoff for reuse. The design was aligned to NRCS Standard 441 to qualify for EQIP funding. 2023 results (2 years post-installation): 88% application efficiency, 41% reduction in total irrigation water use, 214 BPA corn (17.6% yield increase), 66 BPA soybeans (22.2% yield increase), $287,000 in annual combined savings from reduced input costs and increased revenue. The project received $320,000 in EQIP cost share, leading to a 3.2-year total payback period.
Case Study 2: 120-Acre High-Density Apple Orchard, Hudson Valley, New York
Pre-design (2021) baseline: The orchard used a portable sprinkler system with 67% DU, which wetted foliage during irrigation and led to frequent apple scab outbreaks. Average yields were 320 bushels per acre, with an 18% post-harvest fruit cull rate due to uneven water availability. Design solution: Subsurface drip irrigation installed 12 inches deep, with 0.5 GPH pressure-compensating emitters spaced 18 inches apart, integrated fertigation injection ports, soil moisture sensors at 8-inch and 18-inch depths to maintain consistent root zone moisture, and a separate solid-set sprinkler zone for early spring frost protection. 2023 results (2 years post-installation): 93% application efficiency, 92% DU, 38% reduction in water use, 490 bushels per acre yield (53% increase), 7% cull rate (61% reduction), $214,000 in increased annual revenue. The project received $78,000 in New York State Agricultural Non-Point Source Pollution Control grant funding, leading to a 4.1-year payback period.
Case Study 3: 35-Acre Commercial Nursery, Central Florida
Pre-design (2022) baseline: The nursery used a mix of overhead sprinklers and hand-watering, with 62% application efficiency. High application variability led to 29% annual plant loss due to over-saturation or underwatering, with 35 hours per week of labor dedicated to hand-watering potted stock. Design solution: Zoned solid-set sprinkler system, with separate zones for native drought-tolerant plants, high-moisture tropical plants, and seedling propagation beds, using matched precipitation rate nozzles to deliver exact water requirements for each plant type. Drip irrigation was installed for in-ground specimen trees, with an automated controller connected to rain sensors to pause irrigation during rainfall events. 2023 results (1 year post-installation): 81% application efficiency, 47% reduction in water use, 7% annual plant loss (76% reduction), 5 hours per week of irrigation labor (86% reduction), $89,000 in annual combined savings from reduced labor, plant loss, and water costs. The project received $12,000 in Southwest Florida Water Management District rebates, leading to a 1.9-year payback period.
Future-Proofing Commercial Irrigation System Design for Climate Resilience
As climate patterns shift, with more frequent droughts, extreme rainfall events, and rising water costs, commercial irrigation designs must be built to adapt to changing conditions over their 15-40 year service life, rather than being optimized only for current conditions.
Designing for Drought and Water Allocation Uncertainty
2024 NOAA data shows that 68% of the continental U.S. experienced abnormally dry or drought conditions in 2023, leading to 12% average irrigation curtailments for commercial operations in Western and Great Plains states. Key resilience features to integrate into design include: on-farm water storage (ponds or elevated tanks) sized to hold 30 days of peak irrigation demand, to buffer against well yield declines or surface water curtailments; high-efficiency application hardware (SDI or LEPA center pivots) that achieves 90%+ efficiency to stretch limited water allocations; and soil moisture sensor networks that eliminate unnecessary irrigations, reducing total water demand by 20-25% during dry years. Operations with these design features were able to maintain full yields during the 2022 Western U.S. drought, while operations with lower-efficiency systems saw 18-27% yield losses due to curtailments, per USDA data.
Integrating Scalable Smart Technology Without Overbuilding
Many operations make the mistake of either overinvesting in unproven smart technology that fails to deliver ROI, or designing systems with no capacity for future upgrades. The most cost-effective approach is to build scalability into the base design: install underground conduit along mainlines and laterals to accommodate future sensor and control wiring, which reduces future automation retrofit costs by 60% per IA data, even if the initial system uses basic manual controls. Avoid overspecifying technology that does not match operational scale: for example, a 2,000-acre dryland wheat operation that only applies 1-2 supplemental irrigations per year will not see positive ROI from a full VRI system (which would take 18+ years